Downloads
Download


This work is licensed under a Creative Commons Attribution 4.0 International License.
Article
Characterization of Rate of Injection for Low Carbon Fuels in the Common-Rail Direct Injection System
Simon LeBlanc, Binghao Cong, Xiao Yu, and Ming Zheng *
Department of Mechanical, Automotive and Materials Engineering, University of Windsor, 401 Sunset Avenue, Windsor, ON N9B 3P4, Canada
* Correspondence: mzheng@uwindsor.ca
Received: 26 March 2025; Revised: 8 April 2025; Accepted: 25 April 2025; Published: 30 April 2025
Abstract: Internal combustion engines (ICEs) powered by liquid fuels remain the dominant powertrain system for heavy-duty road transportation, benefiting from the high energy density, ease of storage and transportation, and relatively low refueling pressure of traditional liquid hydrogen carbon fuel. However, concerns over tailpipe emissions and greenhouse gas (GHG) effects have driven the search for alternative fuels with lower carbon footprints. ICEs offer a key advantage during this transition, as they can operate on a variety of fuels, enabling a flexible approach to reducing harmful emissions and GHG while maintaining reliable power output. Alternative liquid fuels, such as dimethyl ether (DME), have shown great potential in mitigating environmental impacts while ensuring sufficient engine performance. However, the significantly different physical and chemical properties of renewable fuels necessitate the adoption of tailored combustion strategies to ensure optimal engine operation. In particular, the fuel injection strategy plays a pivotal role in governing the combustion process, as it directly influences fuel-air mixing, ignition characteristics, and hence, the combustion efficiency. Therefore, detailed characterization of the fuel injection process (rate of injection (ROI) profiles, injection delay, and injection quantities) is necessary for research and development of advanced combustion strategies. In this study, the ROI profiles for diesel, DME and polyoxymethylene dimethyl ethers (OME3) were measured using the Bosch long tube method, with diesel severed as the reference fuel. Comparative tests were conducted under varying injection pressures (300 bar to 900 bar) and injection durations (0.3 ms to 3 ms) to investigate the influence of fuel properties on ROI profiles. The results revealed that all three fuels exhibited comparable ROI at injection durations below 700 µs. However, at longer injection durations and higher pressures, significant differences emerged. At a 3 ms injection duration, DME consistently showed the lowest steady-state ROI, while OME3 exhibited the highest across all injection pressures. Furthermore, the discharge coefficient (Cd) increased with injection pressure and converged across three fuels at higher pressures. This indicated that, under those conditions, fuel density became the dominant factor influencing ROI, hence the injection quantities.
Keywords:
rate of injection alternative fuel high pressure injection1. Introduction
Internal combustion engines (ICEs) powered by liquid fuels remain the dominant powertrain system for heavy-duty road transportation, benefiting from the high energy density, ease of storage and transportation, and relatively low refueling pressure of traditional liquid hydrogen carbon fuel. However, concerns over tailpipe emissions and greenhouse gas (GHG) effects have driven the search for alternative fuels with lower carbon footprints [1,2]. Compression ignition (CI) direct injection (DI) engines offer several advantages, making them a preferred choice for heavy-duty road applications with lower carbon footprints. One of their primary benefits is their relatively high thermal efficiency, attributed to the use of high compression ratios and lean fuel-air mixtures [3]. This efficiency results in improved fuel economy and reduced carbon dioxide emissions per unit of power produced. Furthermore, the emission regulations enacted for on-road transportation vehicles are continuously tightening, driving the development and implementation of exhaust aftertreatment technology and advanced combustion strategies to manage the tailpipe emissions to permissible levels. CI engines are highly versatile, capable of running on a variety of fuels to tackle the emission challenges. Ether fuels offer compelling characteristics that present the potential to address challenges associated with clean combustion diesel engines. The high reactivity of DME makes it a suitable fuel for CI combustion, while its notably higher oxygen content can avoid the classical NOx-soot trade-off inherent to diesel-fueled CI combustion [4–8].
The inherently coupled nature of fuel injection and combustion allows precise control over the combustion process by altering the fuel injection strategy. Parameters such as injection timing, fuel quantity, and the number of injection pulses can be flexibly modified to achieve optimized combustion [9]. Such adjustments can reduce combustion noise, enhance thermal efficiency, and minimize emissions. Furthermore, post-injection strategies can be employed to facilitate after-treatment system regeneration, contributing to effective emissions management [10]. Given the critical role of fuel injection in influencing combustion characteristics, precise measurement of the rate of injection (ROI) profiles, including injection delay timing and fuel quantities, is essential. The accurate ROI data is necessary for research and development of advanced combustion strategies, enabling the development of more efficient and cleaner engine technologies.
Numerous studies and extensive literature have focused on the measurement and analysis of diesel ROI. These investigations have highlighted the significant influence of the rate of injection (ROI) profiles on air-fuel mixing and combustion processes. Bai et al. [10] investigated the effects of different ROI shapes on the diesel combustion process and emissions using numerical simulation. In their study, five distinct ROI shapes were analyzed, and the results demonstrated that the shape of ROI notably affected the heat release process, leading to variations in combustion behavior and emissions. Among the investigated profiles, the trapezoidal ROI shape resulted in the lowest soot emissions while maintaining acceptable nitrogen oxide (NOx) emissions. The highest NOx emissions were produced by triangle shape ROI due to its higher peak value of ROI, leading to elevated combustion temperature. Niculate et al. [11] did a similar numerical approach to investigate the shape of ROI effects on combustion and emission. Both diesel and biodiesel were investigated and compared. The authors found that the variation in ROI shapes for diesel and biodiesel showed a similar response in the emission stand of view. They concluded that the group of injection shapes presenting a fast increase of the ROI at the beginning produces higher values of NOx emissions and lower soot emissions compared to the trapezoid shape of ROI. This is owing to the higher injection quantity in the early stage promotes pre-mixed combustion. In stark contrast, the group of injection shapes presenting a fast increase of the ROI at a later stage produces lower NOx emissions and higher soot emissions.
Nishimura et al. [12] investigated the effects of different ROI patterns on combustion characteristics and emissions in a DI diesel engine. The authors utilized nozzle needle lift control to slowly lift the needle valve and thus created a gradual ramping up ROI shape. They found that the initial stage of ROI is restricted, and less pre-mixed combustion was observed in the rate of heat release curve, and the diffusion combustion occurred very slowly. However, the restricted initial ROI also mitigated the atomization and spray travel distance. As a result, the smoke emission deteriorated.
As mentioned above, the diesel combustion and emission management strategies for direct injection systems depend strongly on the fuel delivery process. Thus, an accurate measurement of fuel injection processes is valuable towards the understanding and management of combustion events. However, concerns over tailpipe emissions and greenhouse gas (GHG) effects have driven the search for cleaner alternatives. Alternative compressible liquid fuels, such as dimethyl ether (DME), have shown great potential in mitigating environmental impacts while ensuring efficient engine performance. Some of these alternative fuels exhibit significantly different physical and chemical properties. This necessitates the adoption of tailored combustion strategies to ensure optimal engine operation.
Lee et al. [13] investigated the injection behavior of diesel and DME using a common-rail system, finding that at short energizing durations, both fuels delivered similar quantities. However, as the energizing duration increased, diesel showed a higher injected amount. In a later study, Kim, et al. [14] further analyzed the injection characteristics of the two fuels, reporting that at a 700 μs energizing pulse, diesel’s peak injection rate was roughly 1.4 times greater than DME’s. Additionally, DME demonstrated a longer closing delay compared to diesel. Expanding on these results, the researchers tested additional injection pressures and observed trends consistent with their earlier findings [13]. Nonetheless, there remains a lack of empirical data on DME injection, and the expected injection profile of DME in diesel injectors is still not well understood.
There is a noticeable lack of direct comparisons between diesel and alternative fuels like dimethyl ether DME in terms of their ROI profiles. Given the distinct physical and chemical properties of alternative fuels, understanding their injection behavior is crucial for developing accurate models and optimizing combustion strategies.
In this study, the ROI profiles of diesel, OME3, and DME were measured using the Bosch long tube method. Furthermore, a comparative analysis of the injection rate profiles of these fuels across a range of testing conditions was performed.
2. Methodology
In this section, the experimental platforms employed for measuring ROI profiles for both diesel and alternative fuels are detailed, including specific methodologies and testing procedures.
2.1. Rate of Injection Platforms
Two injection measurement platforms were used to measure the injection profile. The EFS injection measurement bench (EFS ITB132R) was calibrated and operated with ISO 4113 calibration fluid (engineered fluid to simulate diesel characteristics). The system can perform both dynamic ROI measurement and fuel injection quantity measurement. However, it is inconvenient to operate multiple fuels on the platform. Thus, an in-house designed long tube ROI test bench based on Bosch principle was employed to investigate the performance of a high-pressure direct injection diesel injector using various types of fuel. In a previous study [15], the authors showed that the long tube platform was applicable to measure the injection profiles of alternative fuels. In this study, both systems were used to measure the injection profiles for diesel fuel, and the results were compared. The ROI profiles for alternative fuels were investigated solely by the long tube platform.
2.1.1. Long Tube Rate of Injection Measurement Platform
An in-house designed long tube ROI test bench based on Bosch principle was used to measure the ROI for a wide range of fuels. The long tube platform consisted of a high-pressure injection pump and a pressure measurement chamber, linked to a 50-meter-long tube (coiled into 26 turns). An overview of the ROI platform was shown in Figure 1. The fuel injection control signals were initiated using a National Instruments RT-FPGA system, which also triggers the data acquisition system.
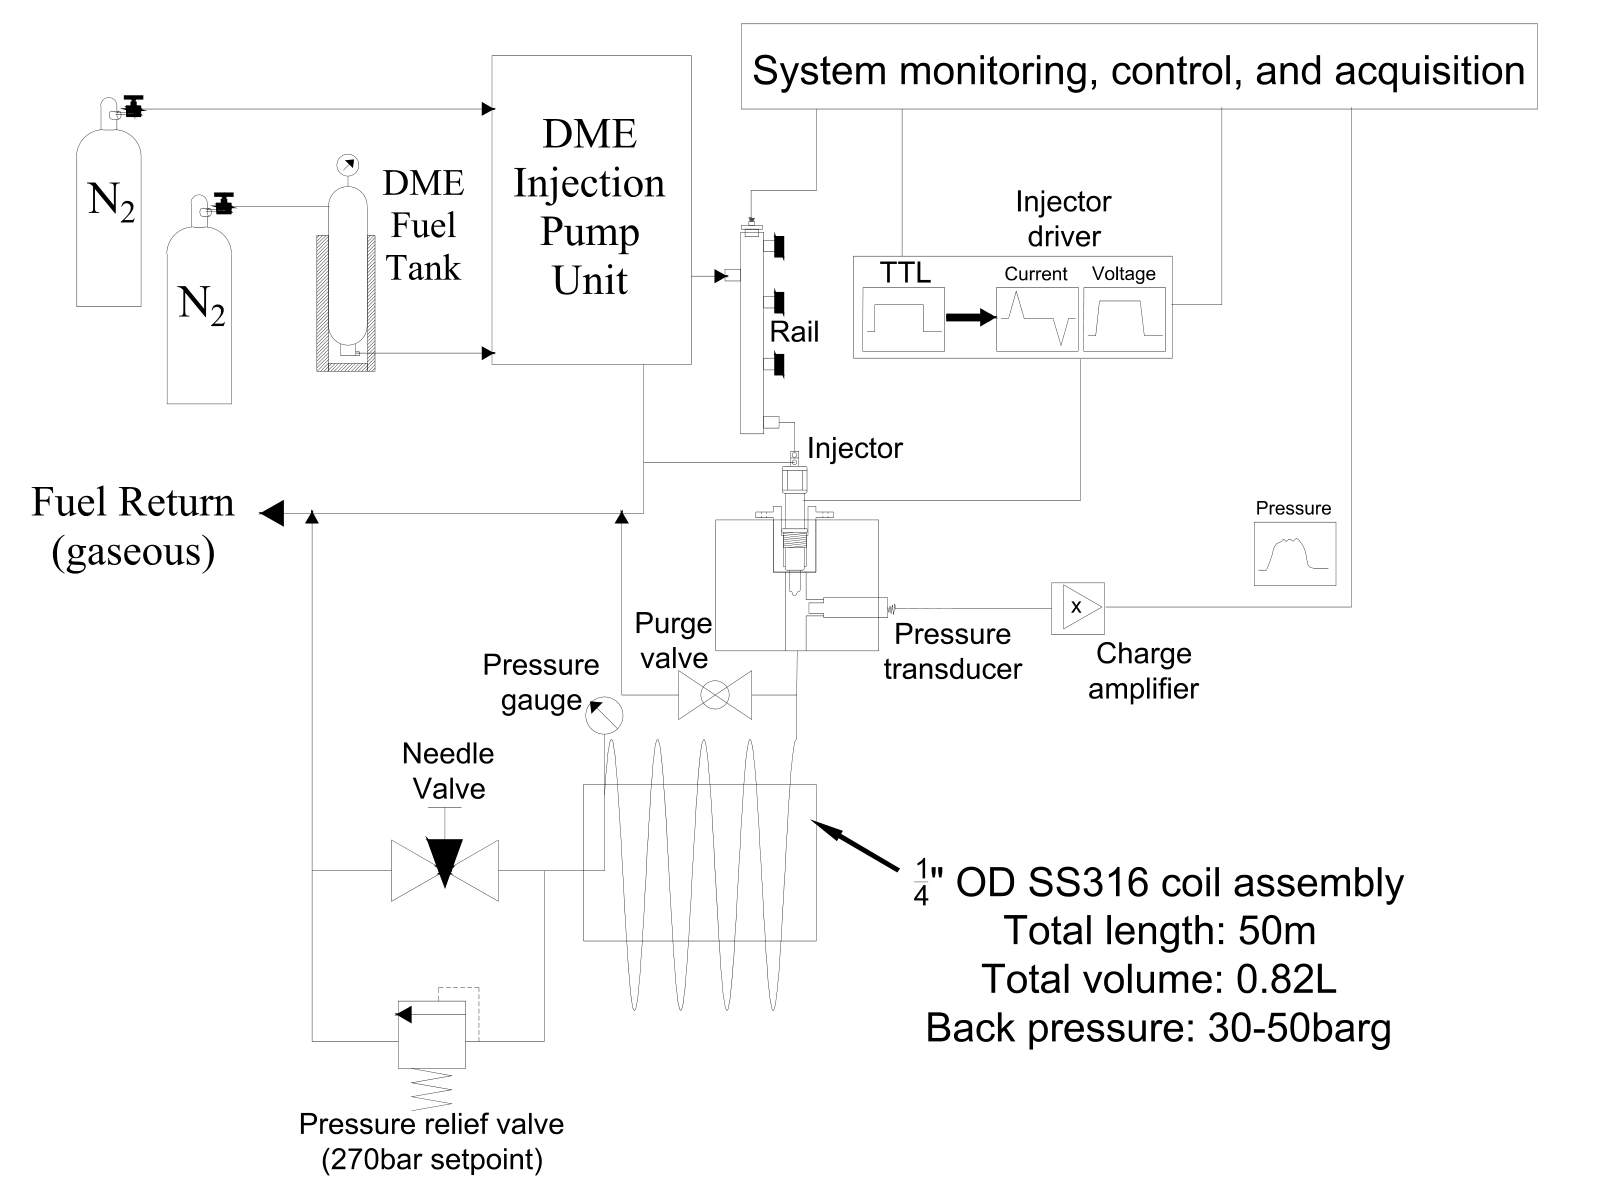
Figure 1. Experimental setup of the long tube platform.
The Bosch method principally required both the chamber, and the extended tube were filled with the same liquid fuel, free from air pockets. A low-pressure diesel supply cart delivered fuel through a needle valve to fill the system. A 1-gallon reservoir was pressurized with nitrogen to around 11 bar after filling with DME, which kept the DME in a liquid state within the long tube system. A pressure gauge and a needle valve were installed to regulate the background pressure in the long tube.
A set of tests was performed previous to the injector characterization to benchmark the impact of background pressure on the ROI measurement. The results revealed that a back pressure above 20 bar showed a negligible impact on the ROI measurement, as shown in Figure 2. For this work, a background pressure of 40 bar gauge (barg) was maintained.
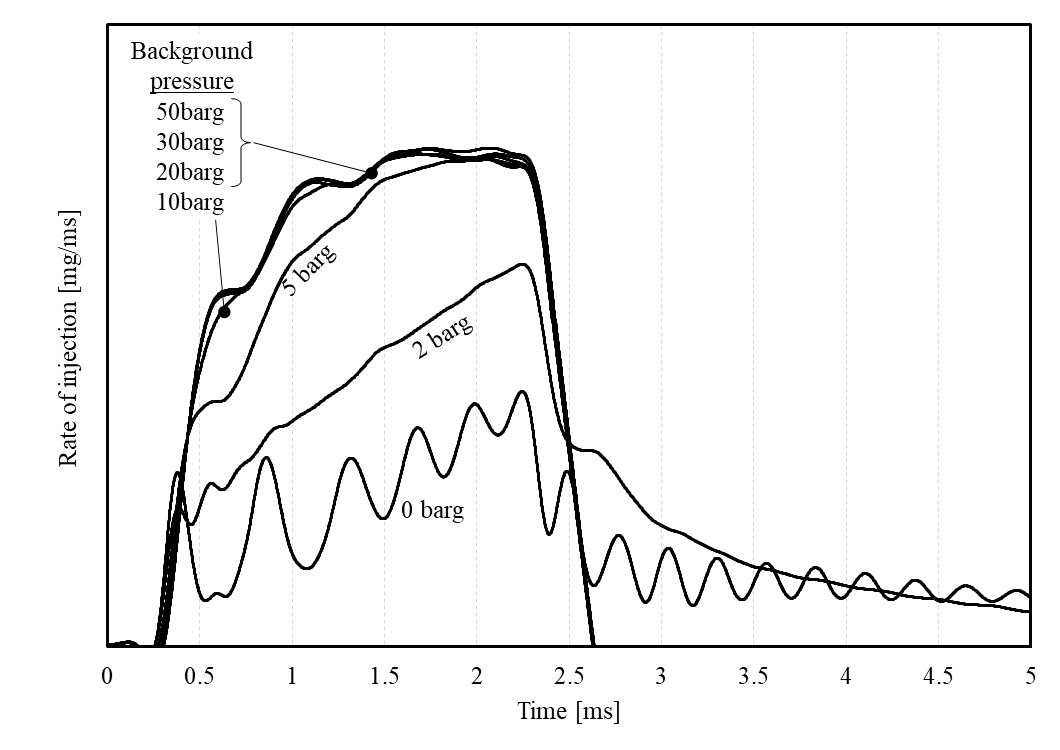
Figure 2. Background pressure effects on the rate of injection profiles.
A Maximator LSF100-2 (Maxpro Technologies, Fairview, PA, USA) pneumatically driven double-air liquid pump was used to pressurize the fuel for high-pressure injection. The sealing materials (PTFE) for the pump are compatible with highly aggressive chemicals, and the pump is applicable to pressurize a number of alternative fuels. A commercial piezoelectric diesel injector with a 6 × 150 µs nozzle configuration was used in this study. The injector was fitted onto a stainless-steel chamber with a side-mounted pressure transducer. During the injection event, the transient fuel supply increased the chamber pressure promptly. The pressure curve recorded by the pressure transducer corresponds to the ROI profile. The theoretical calculation from pressure to gravimetric ROI is shown in Equation (1), as follows [16]:
where A is the cross-sectional area in the measurement chamber, c is the speed of sound of the background media (test fuel), and p(i) is the measured pressure.
Figure 3 shows a demonstration case for the ROI profile, injector control signals, and the derived parameters. The ROI profile can be divided into three distinct phases: the rising phase, where the injection began and ROI rapidly increased; the steady-state phase, during which fuel delivery stabilized; and the decaying phase, where the ROI gradually decreased as the injector closed. These phases corresponded closely to the dynamic response of the injector during the injection event and provided a basis for analyzing injection behavior and fuel delivery characteristics. The fuel injection timing can be determined based on the rising slope of the pressure curve, while the end of injection was challenging to determine accurately from the pressure curve because of the oscillating pressure waves. Therefore, the end of the fuel delivery slope was extended with a linear fit line.
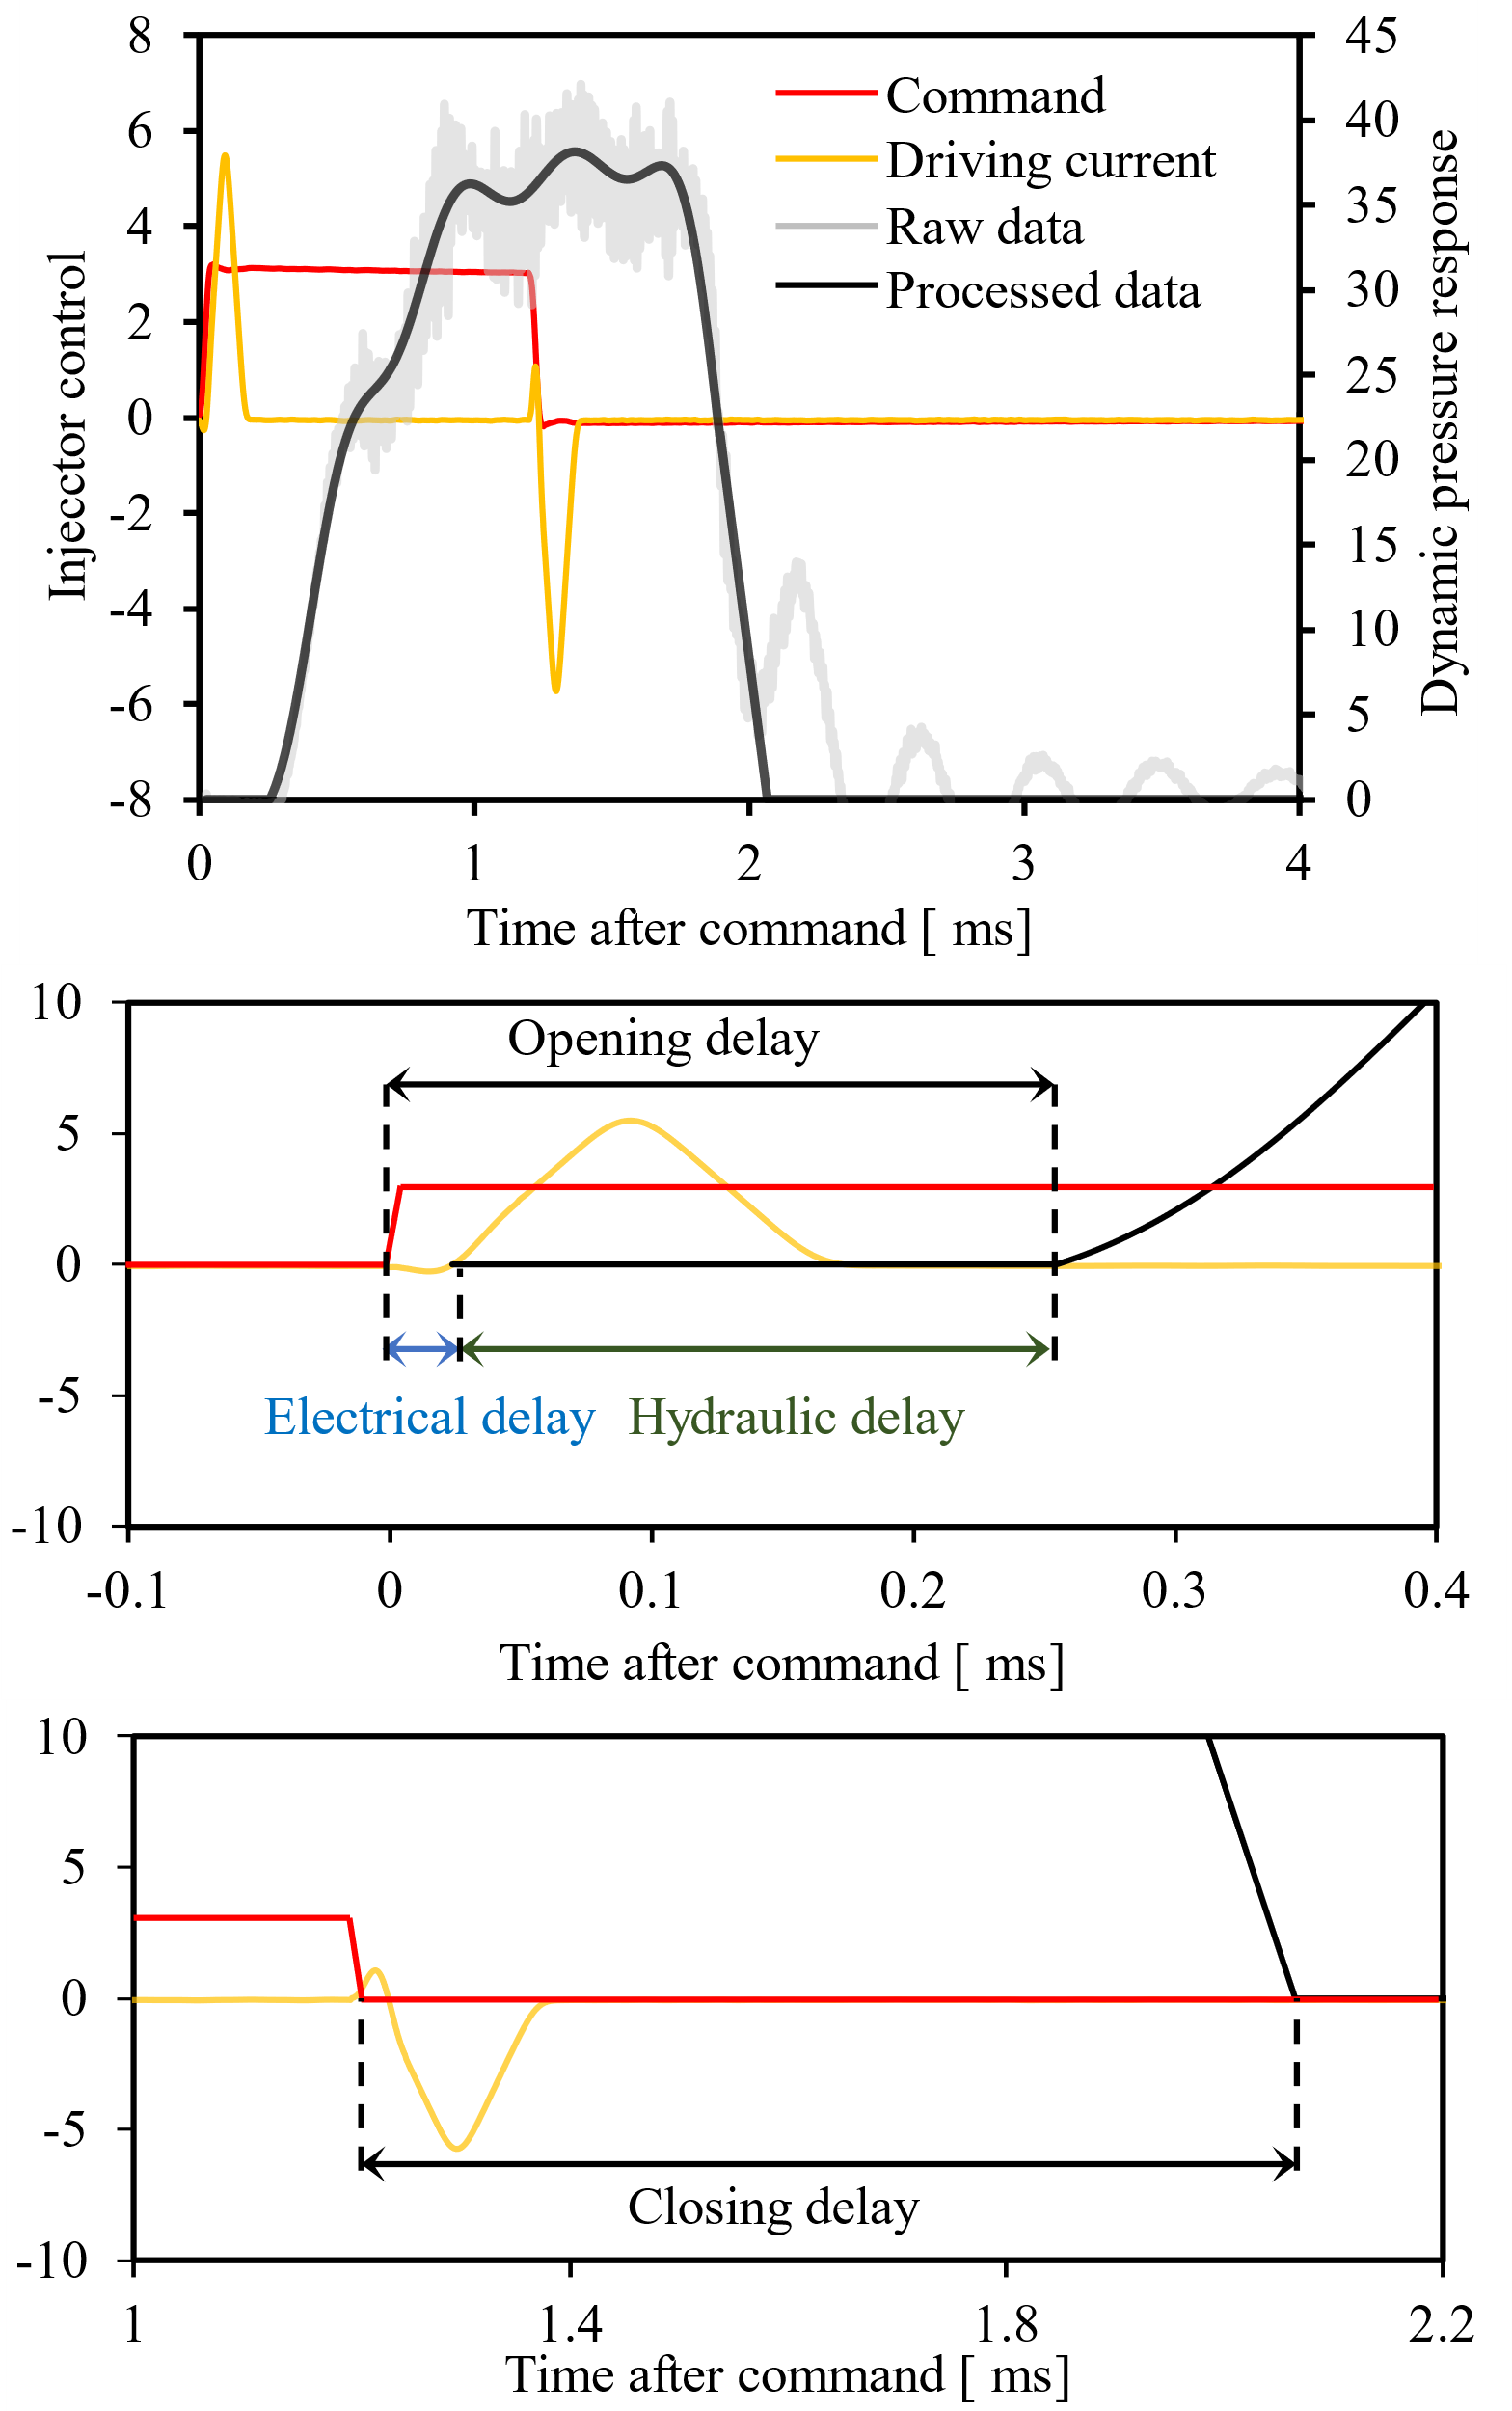
Figure 3. Fuel injection profile and parameter definition.
2.1.2. EFS Rate of Injection Measurement Platform
The EFS injection measurement bench (EFS ITB132R) is a commercial injection test bench platform for injector characterization. The measurement bench is capable of measuring both the injection mass and the rate of injection profile on a shot-to-shot basis. The measurement bench consists of a closed-volume chamber measurement system (transient ROI measurement), a pressure regulation system (fuel injection pressure and backpressure regulation), and a volumetric measurement system (injection volume measurement).
The ROI and total injection amount were measured with three processes in sequential order. The transient fuel injection caused an increase in pressure in the measurement chamber. The pressure was recorded by a pressure transducer and derived to the ROI profile. The slight increase in background pressure owing to the fuel injection was alleviated through an electro-valve. The fuel was then fed to a volumetric measurement system. The volumetric measurement system used a piston to measure the volume of the injected fuel. Once the injection volume measurement is obtained, the fuel is released to the reservoir. This order of process was repeated for each injection event.
2.2. Comparison of Test Platforms
Several published studies [17,18] indicated that the ROI measurement results from the long tube system showed some inconsistencies with other ROI measurement systems. In this section, the ROI measurement results from the long tube platform were compared to those of the EFS platform. The difference in ROI measurement results between the two platforms was discussed.
Figure 4 presents the ROI profiles at an injection pressure of 600 bar for the long tube platform and the EFS platform. The ROI profiles from both platforms aligned well, particularly in terms of injector opening and closing timing. Minor differences were observed in the transient rising stage. The long tube platform showed a slight reduction in ROI profiles around 0.5 ms. Furthermore, marginally lower maximum ROI values in the steady state were also observed in the long tube platform. As the injection duration increased, the ROI profiles maintained a consistent pattern. The opening delay exhibited minimal variation between the two systems, ranging from 260 µs to 265 µs. However, the long tube platform showed an obvious increase in closing delay with longer injection durations.
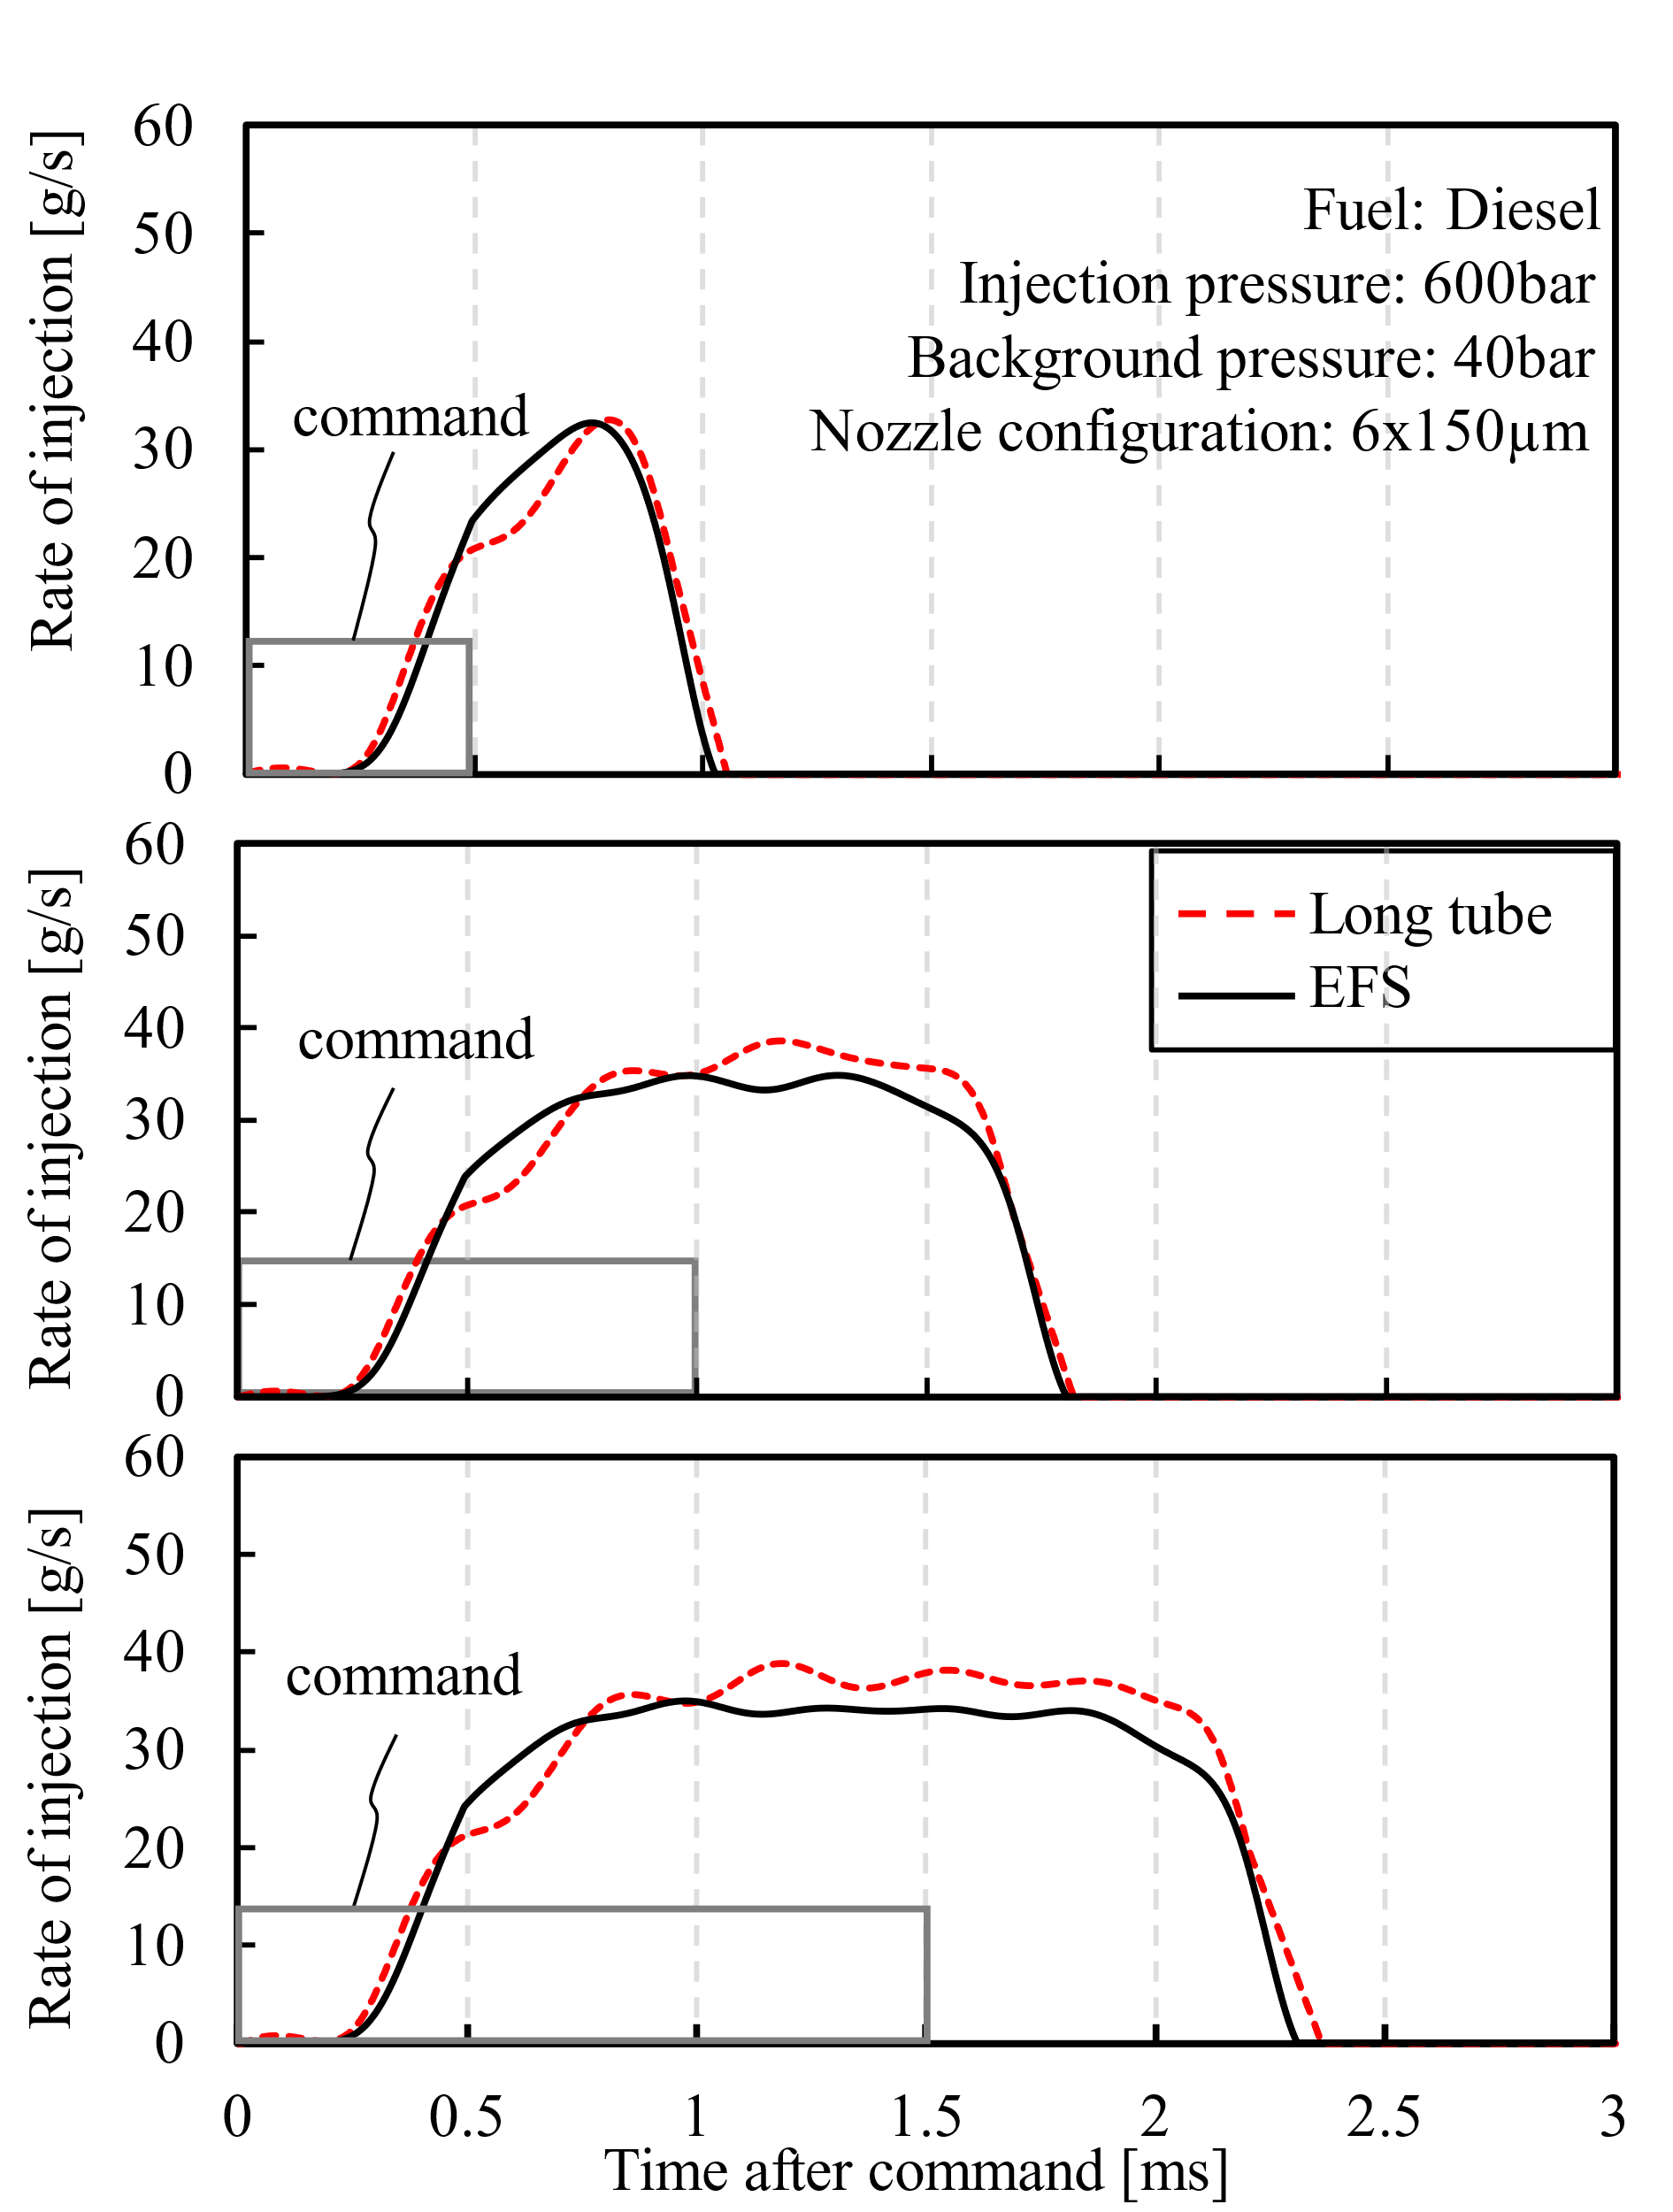
Figure 4. Injection duration impact on ROI for diesel, OME3, and DME.
The injection duration impact on the injection delays is shown in Figure 5. Both the long tube and EFS platforms showed similar trends, the opening delay remained relatively unchanged as the injection duration increased. The closing delay initially increased linearly with injection duration, but further extending the injection duration had little effect on the closing delay. Comparatively, the injector opening delay between the two systems showed only minor differences across the range of injection durations. However, the long tube platform consistently showed a longer closing delay. Additionally, at longer injection duration (plateau phase), the closing delay for the long tube platform exhibited slight fluctuations. As mentioned above, the closing delay determination was obtained from processed data. These post-processing effects may have contributed to the longer closing delay observed on the long tube platform. To further validate the accuracy of the injector closing time. A high-speed camera was utilized to capture the fuel spray development in a constant volume chamber. A detailed description of the constant volume chamber and imaging system can be found in [19].
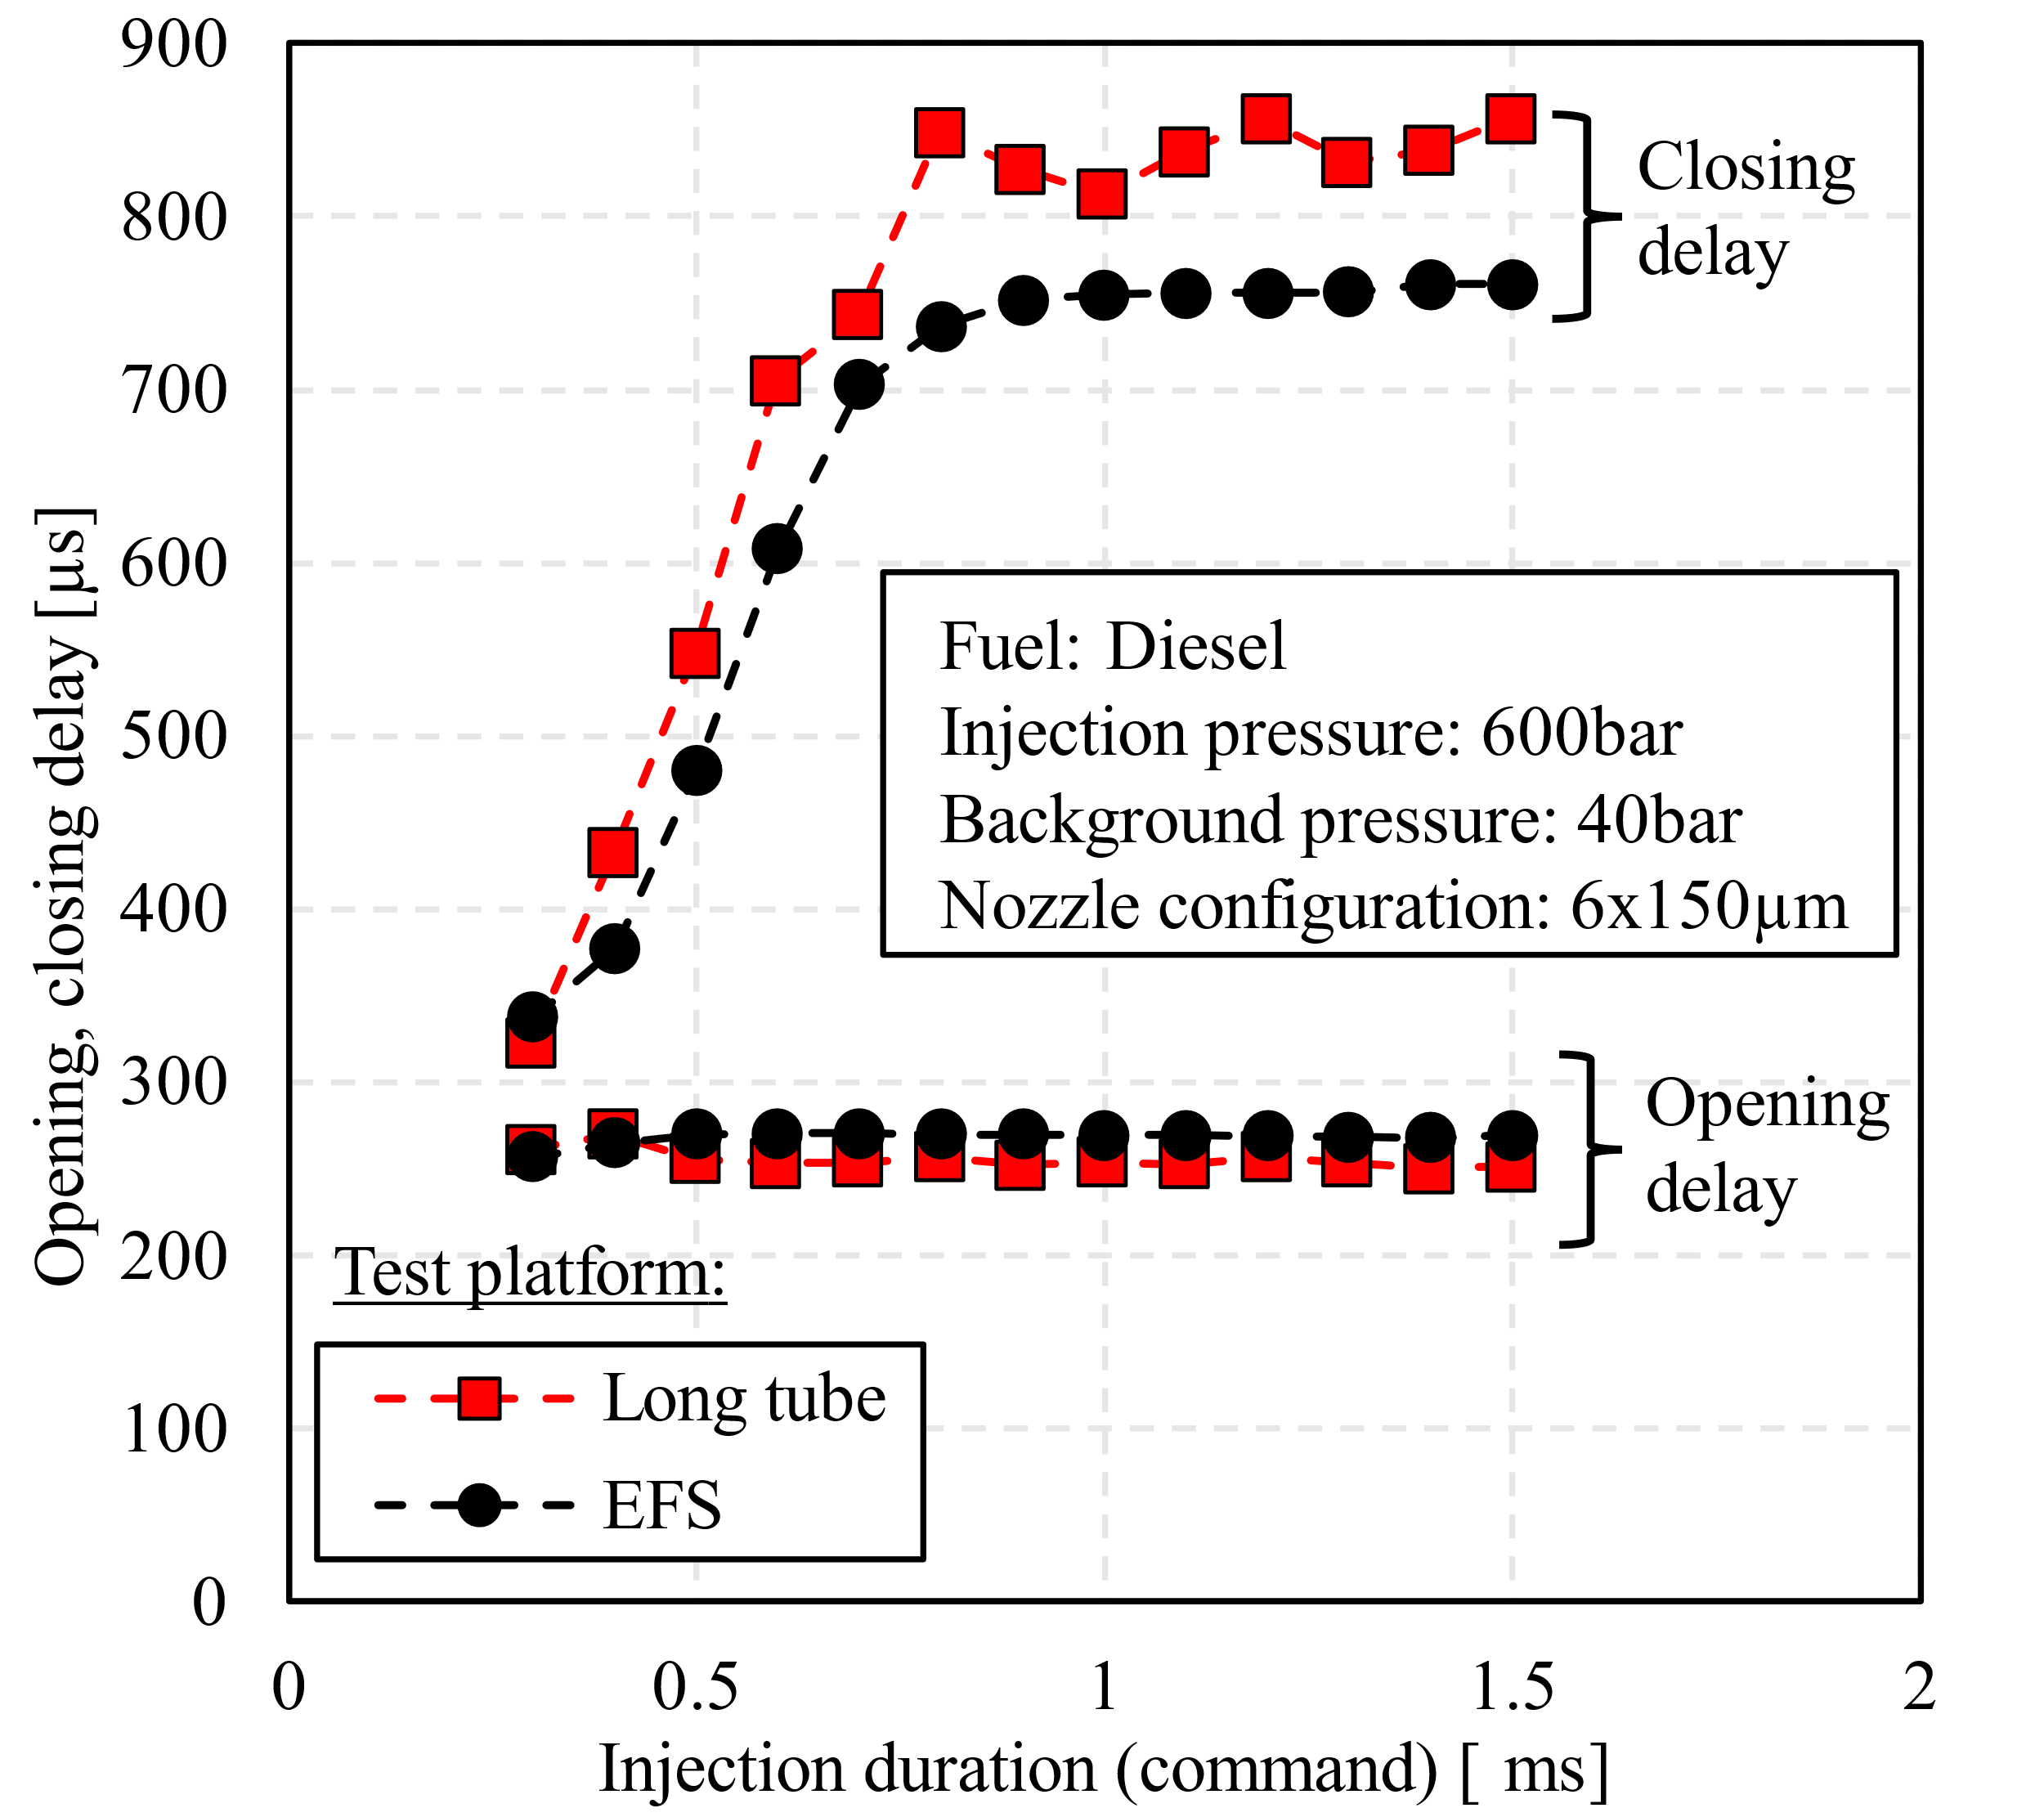
Figure 5. Injection duration impact on opening delay and closing delay for diesel, OME3, and DME.
Figure 6 shows the injector opening and closing timing measured by the EFS platform and by using high-speed imaging. The test was conducted at an injection pressure of 900 bar, with a 1 ms injection command duration. The injector was equipped with an 8 × 110 µm nozzle configuration. Several images corresponding to key phases of the injection event were selected to present here. Image 1 was captured when the injector signal was sent to the injector driver. It showed the background of the view before the injector opens. The fuel spray was first observed in image 2, indicating the injector opening time. A slight discrepancy in the injector opening time between the EFS platform and the high-speed camera was observed. Image 3 captured the fully developed spray during the steady-state injection phase. Image 4 showed the spray dissipation as the injector closed. By correlating the visual evidence with the EFS platform ROI data, the accuracy of the injector opening and closing times can be assessed under these test conditions.
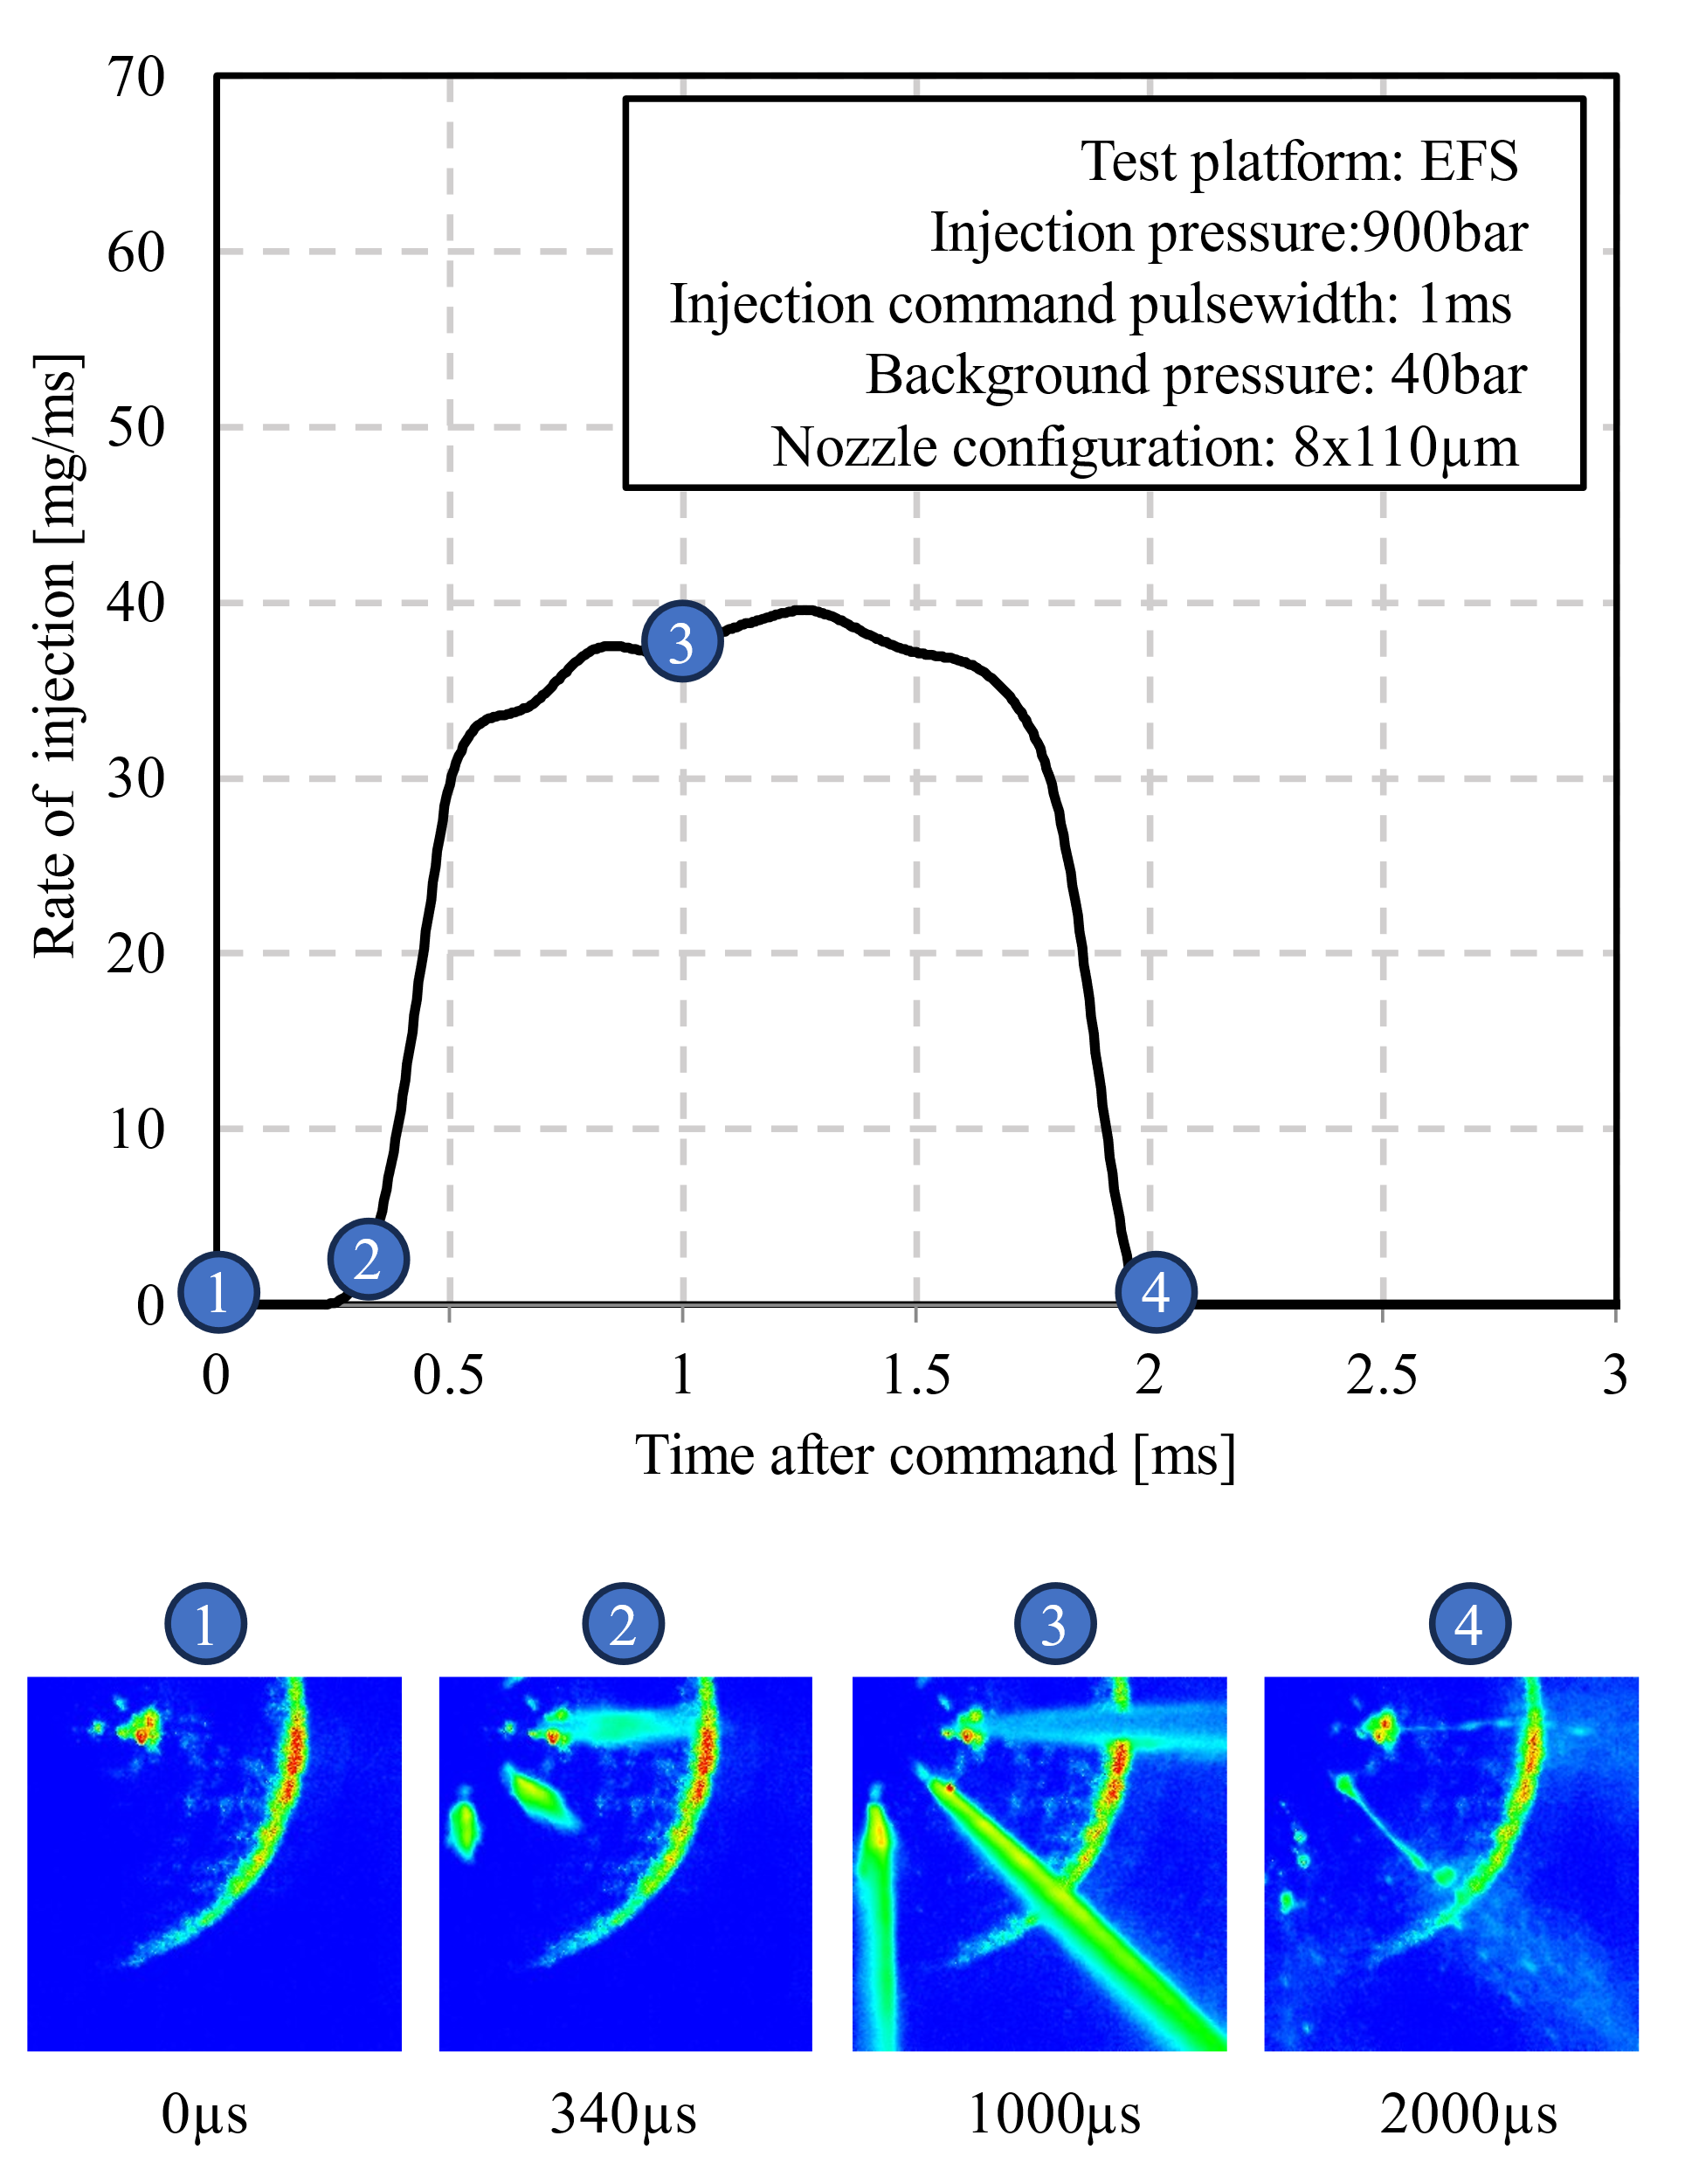
Figure 6. High-speed imaging for fuel spray development in a constant volume chamber vs. ROI measurement from the EFS platform.
Figure 7 shows the injector opening and closing delays measured by the EFS platform and the high-speed imaging over an extended test condition. The blue circles represented data obtained from high-speed imaging, and the red squares represented measurements from the EFS platform. The results showed minor discrepancies in determining the injector delay, especially in the closing delay. Therefore, the closing delay obtained from the EFS platform is more reliable.
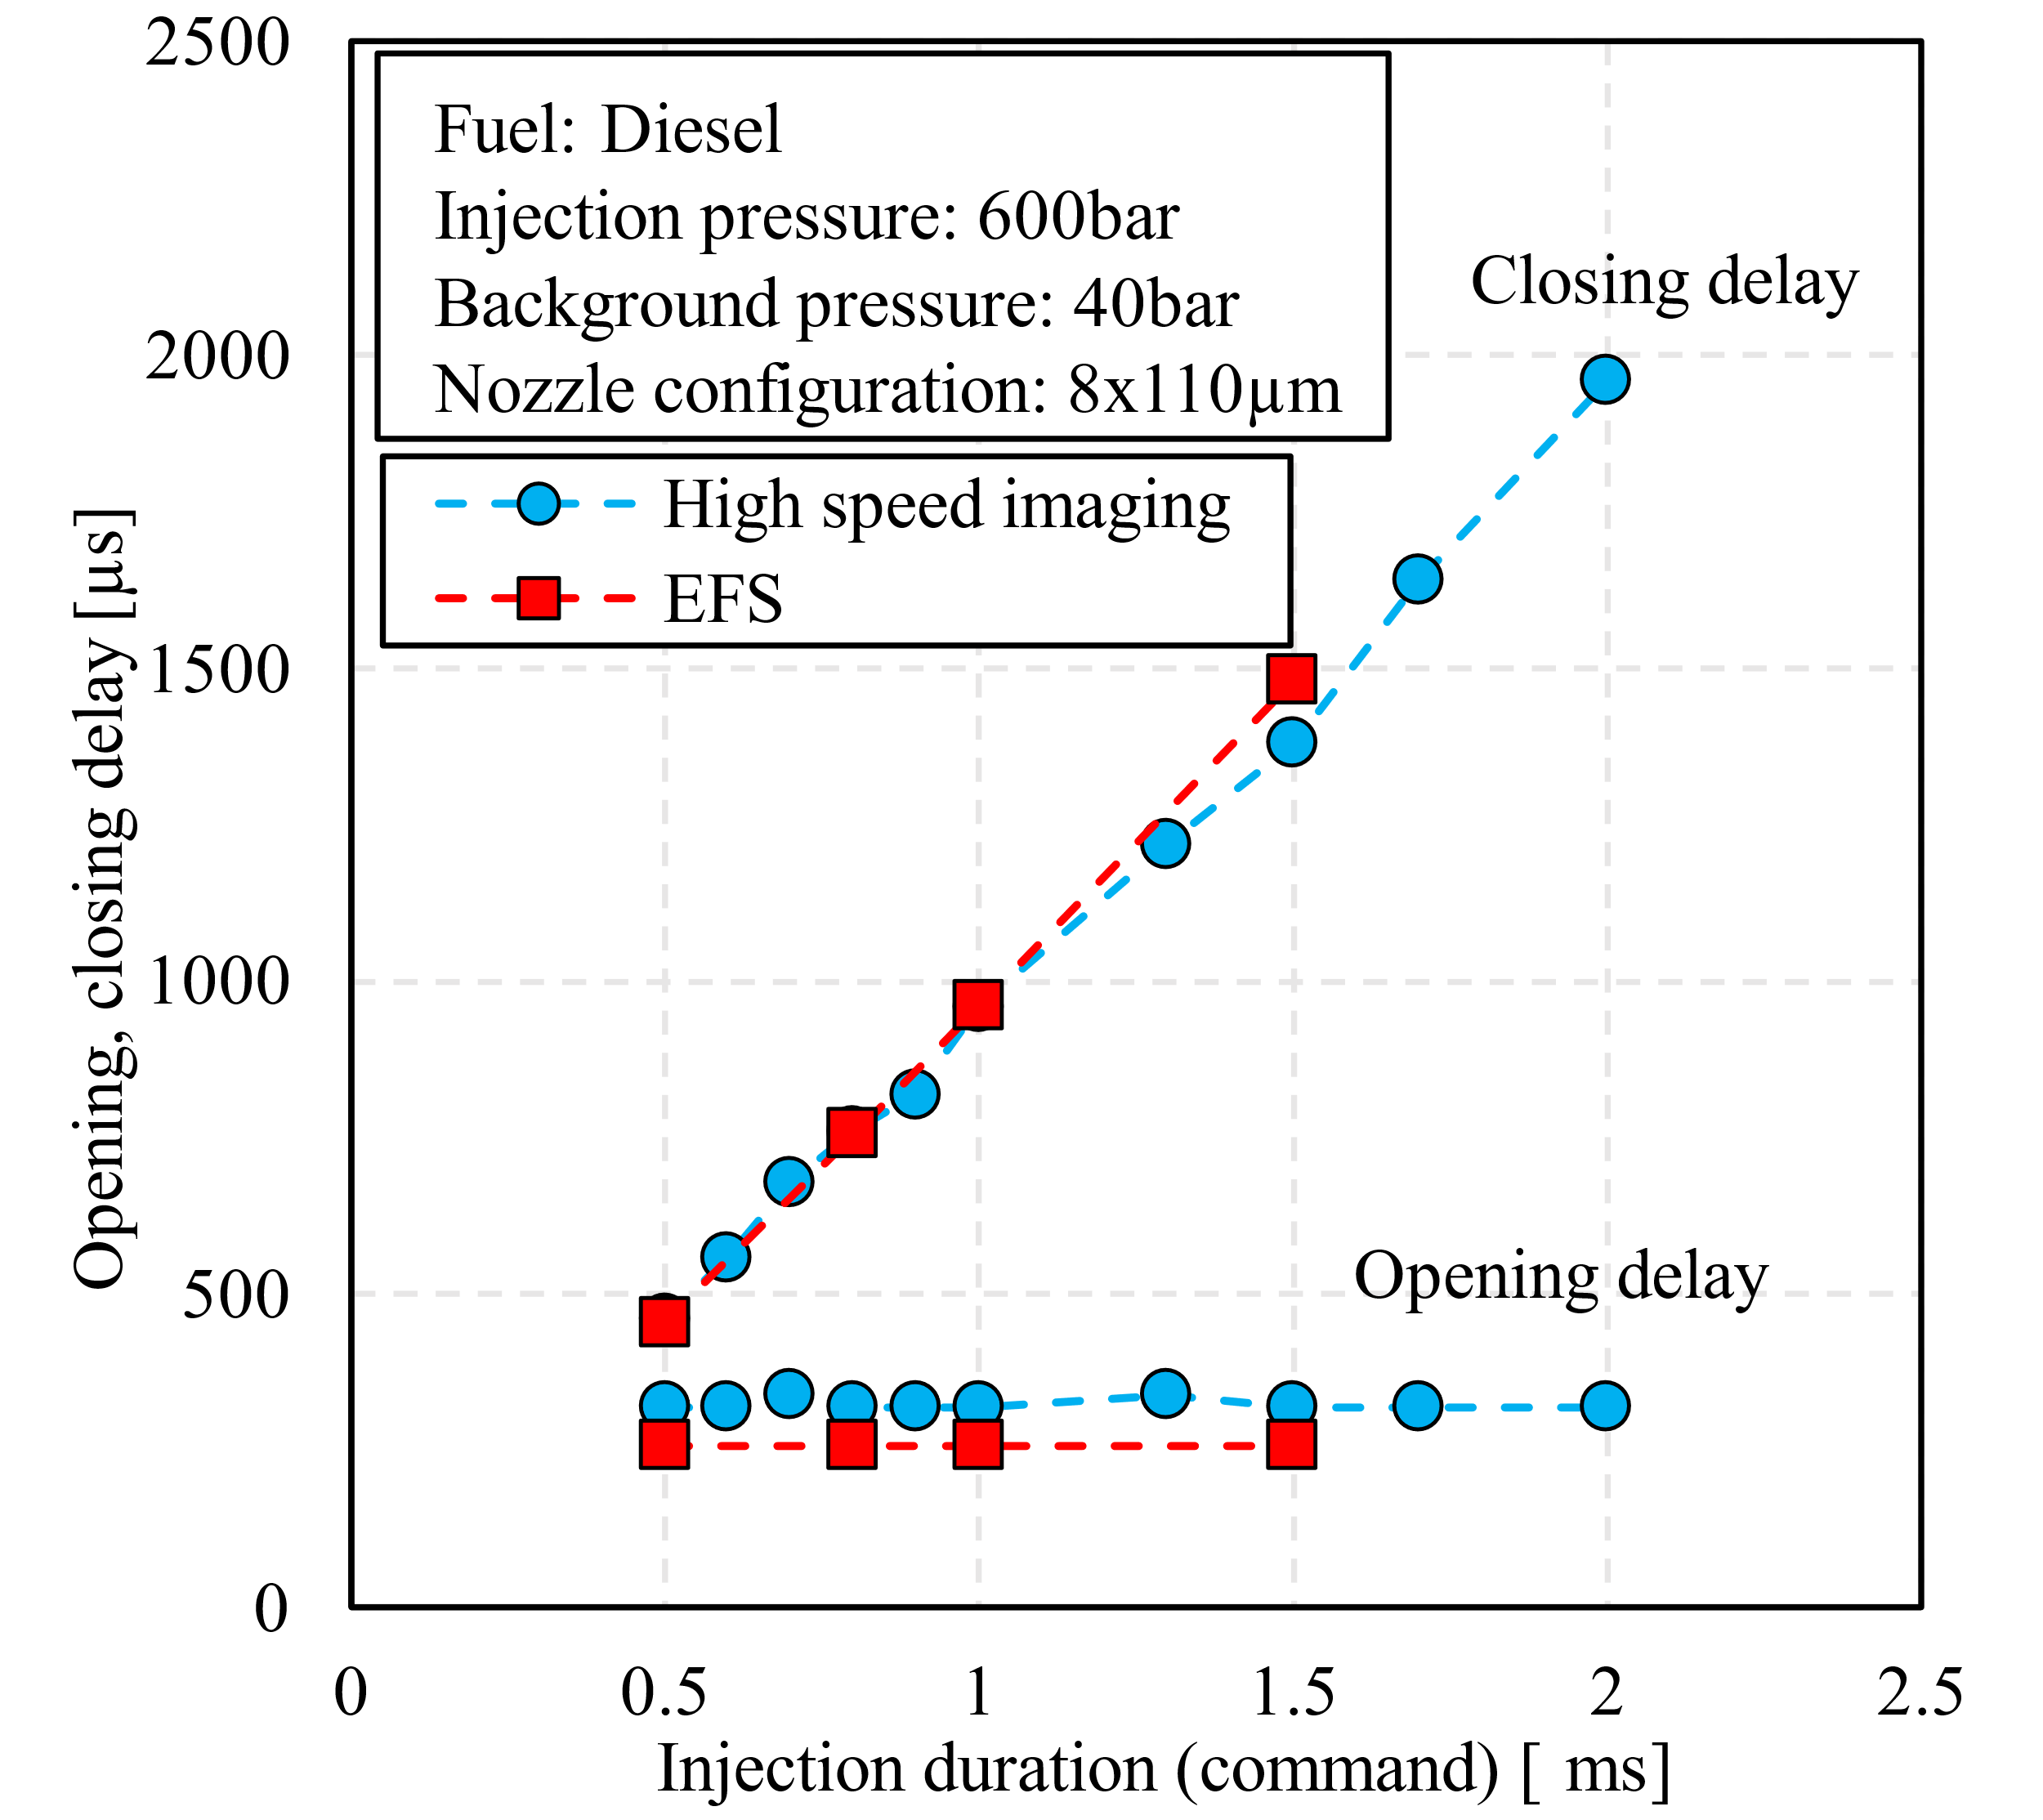
Figure 7. Injector opening and closing delays were measured by the EFS platform and high-speed imaging.
In conclusion, the ROI measurement obtained from the long tube platform and the EFS platform showed good agreement. Despite the long tube platform showing a slightly longer closing delay and higher steady state ROI, the difference was marginal. Therefore, the long tube platform was reliable to be used for investigating the ROI profiles for different fuels.
3. Results and Discussion
The previous section provided a detailed description of the long tube system; the measurements from the long tube system were validated by the EFS system. The long tube system was convenient to operate on alternative fuels such as DME. Therefore, the comparison studies for different fuels were performed solely on the long tube system. This section presents the results of the ROI measurement for diesel, DME, and OME3. The effect of injection duration and injection pressure on ROI was investigated. The injection delay and injection quantity were also analyzed at different injection durations and injection pressures.
3.1. Rate of Injection Profiles for Different Fuels
Figure 8 illustrates the injection duration impact on the ROI for diesel, OME3, and DME. The ROI profiles of these three fuels at an injection pressure of 600 bar and a background pressure of 40 bar across three injection durations. At a 0.5 ms command duration, all three fuels exhibited similar ROI profiles, with DME showing a slightly lower peak ROI. As the injection duration increased to 1 ms and 1.5 ms, steady-state ROI periods were observed for all three fuels. During these steady-state periods, differences in ROI became more pronounced, with OME3 showing a slightly higher ROI compared to diesel and DME. Additionally, the opening and closing delays for all three fuels remained relatively consistent across all injection durations.
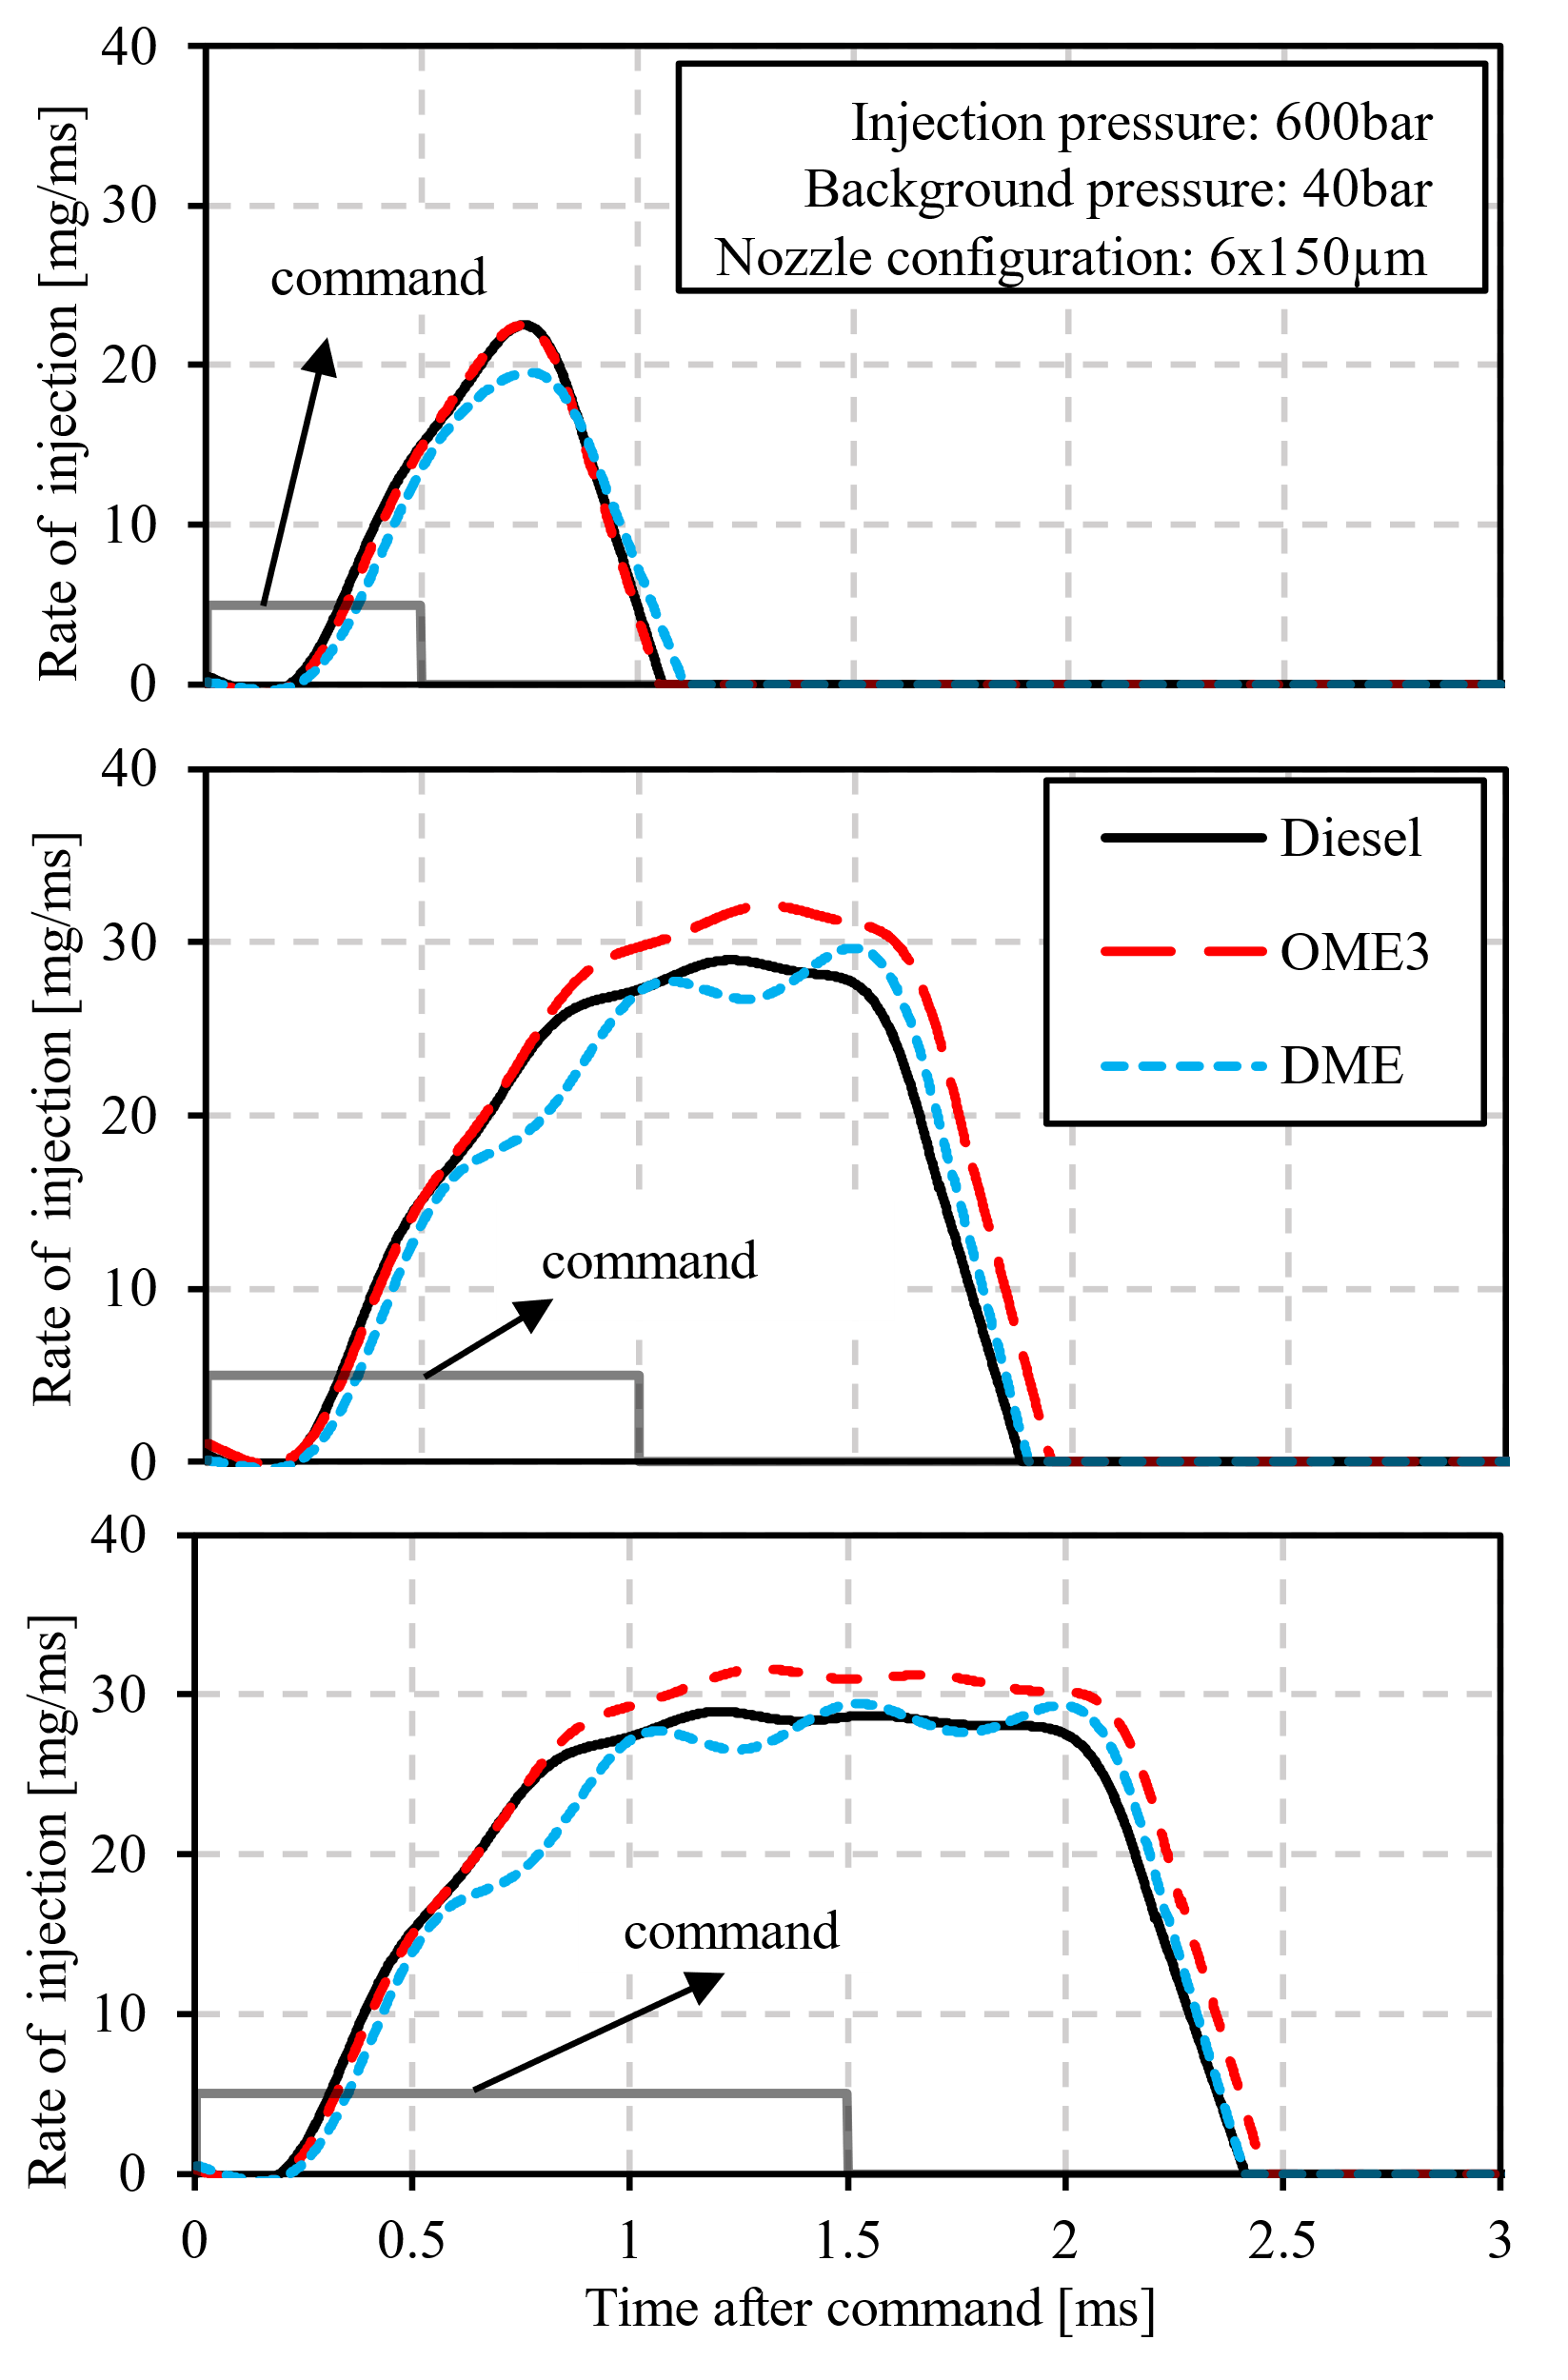
Figure 8. Injection duration impact on diesel, OME3, and DME ROI profiles.
Figure 9 illustrates the injection pressure impact on the ROI for diesel, DME, and OME3. The ROI profiles were compared at injection pressures of 300 bar and 900 bar, with a constant injection duration of 1 ms. The opening and closing delay for all fuels remained relatively consistent across both injection pressures. At 300 bar injection pressure, diesel and DME exhibited similar ROI profiles, while DME showed a slightly slower rate of increase. At 900 bar injection pressure, the ROI increasing rates for all fuels became more comparable. However, the difference in ROI during the steady state period becomes pronounced, with OME3 showing the highest ROI and DME the lowest.
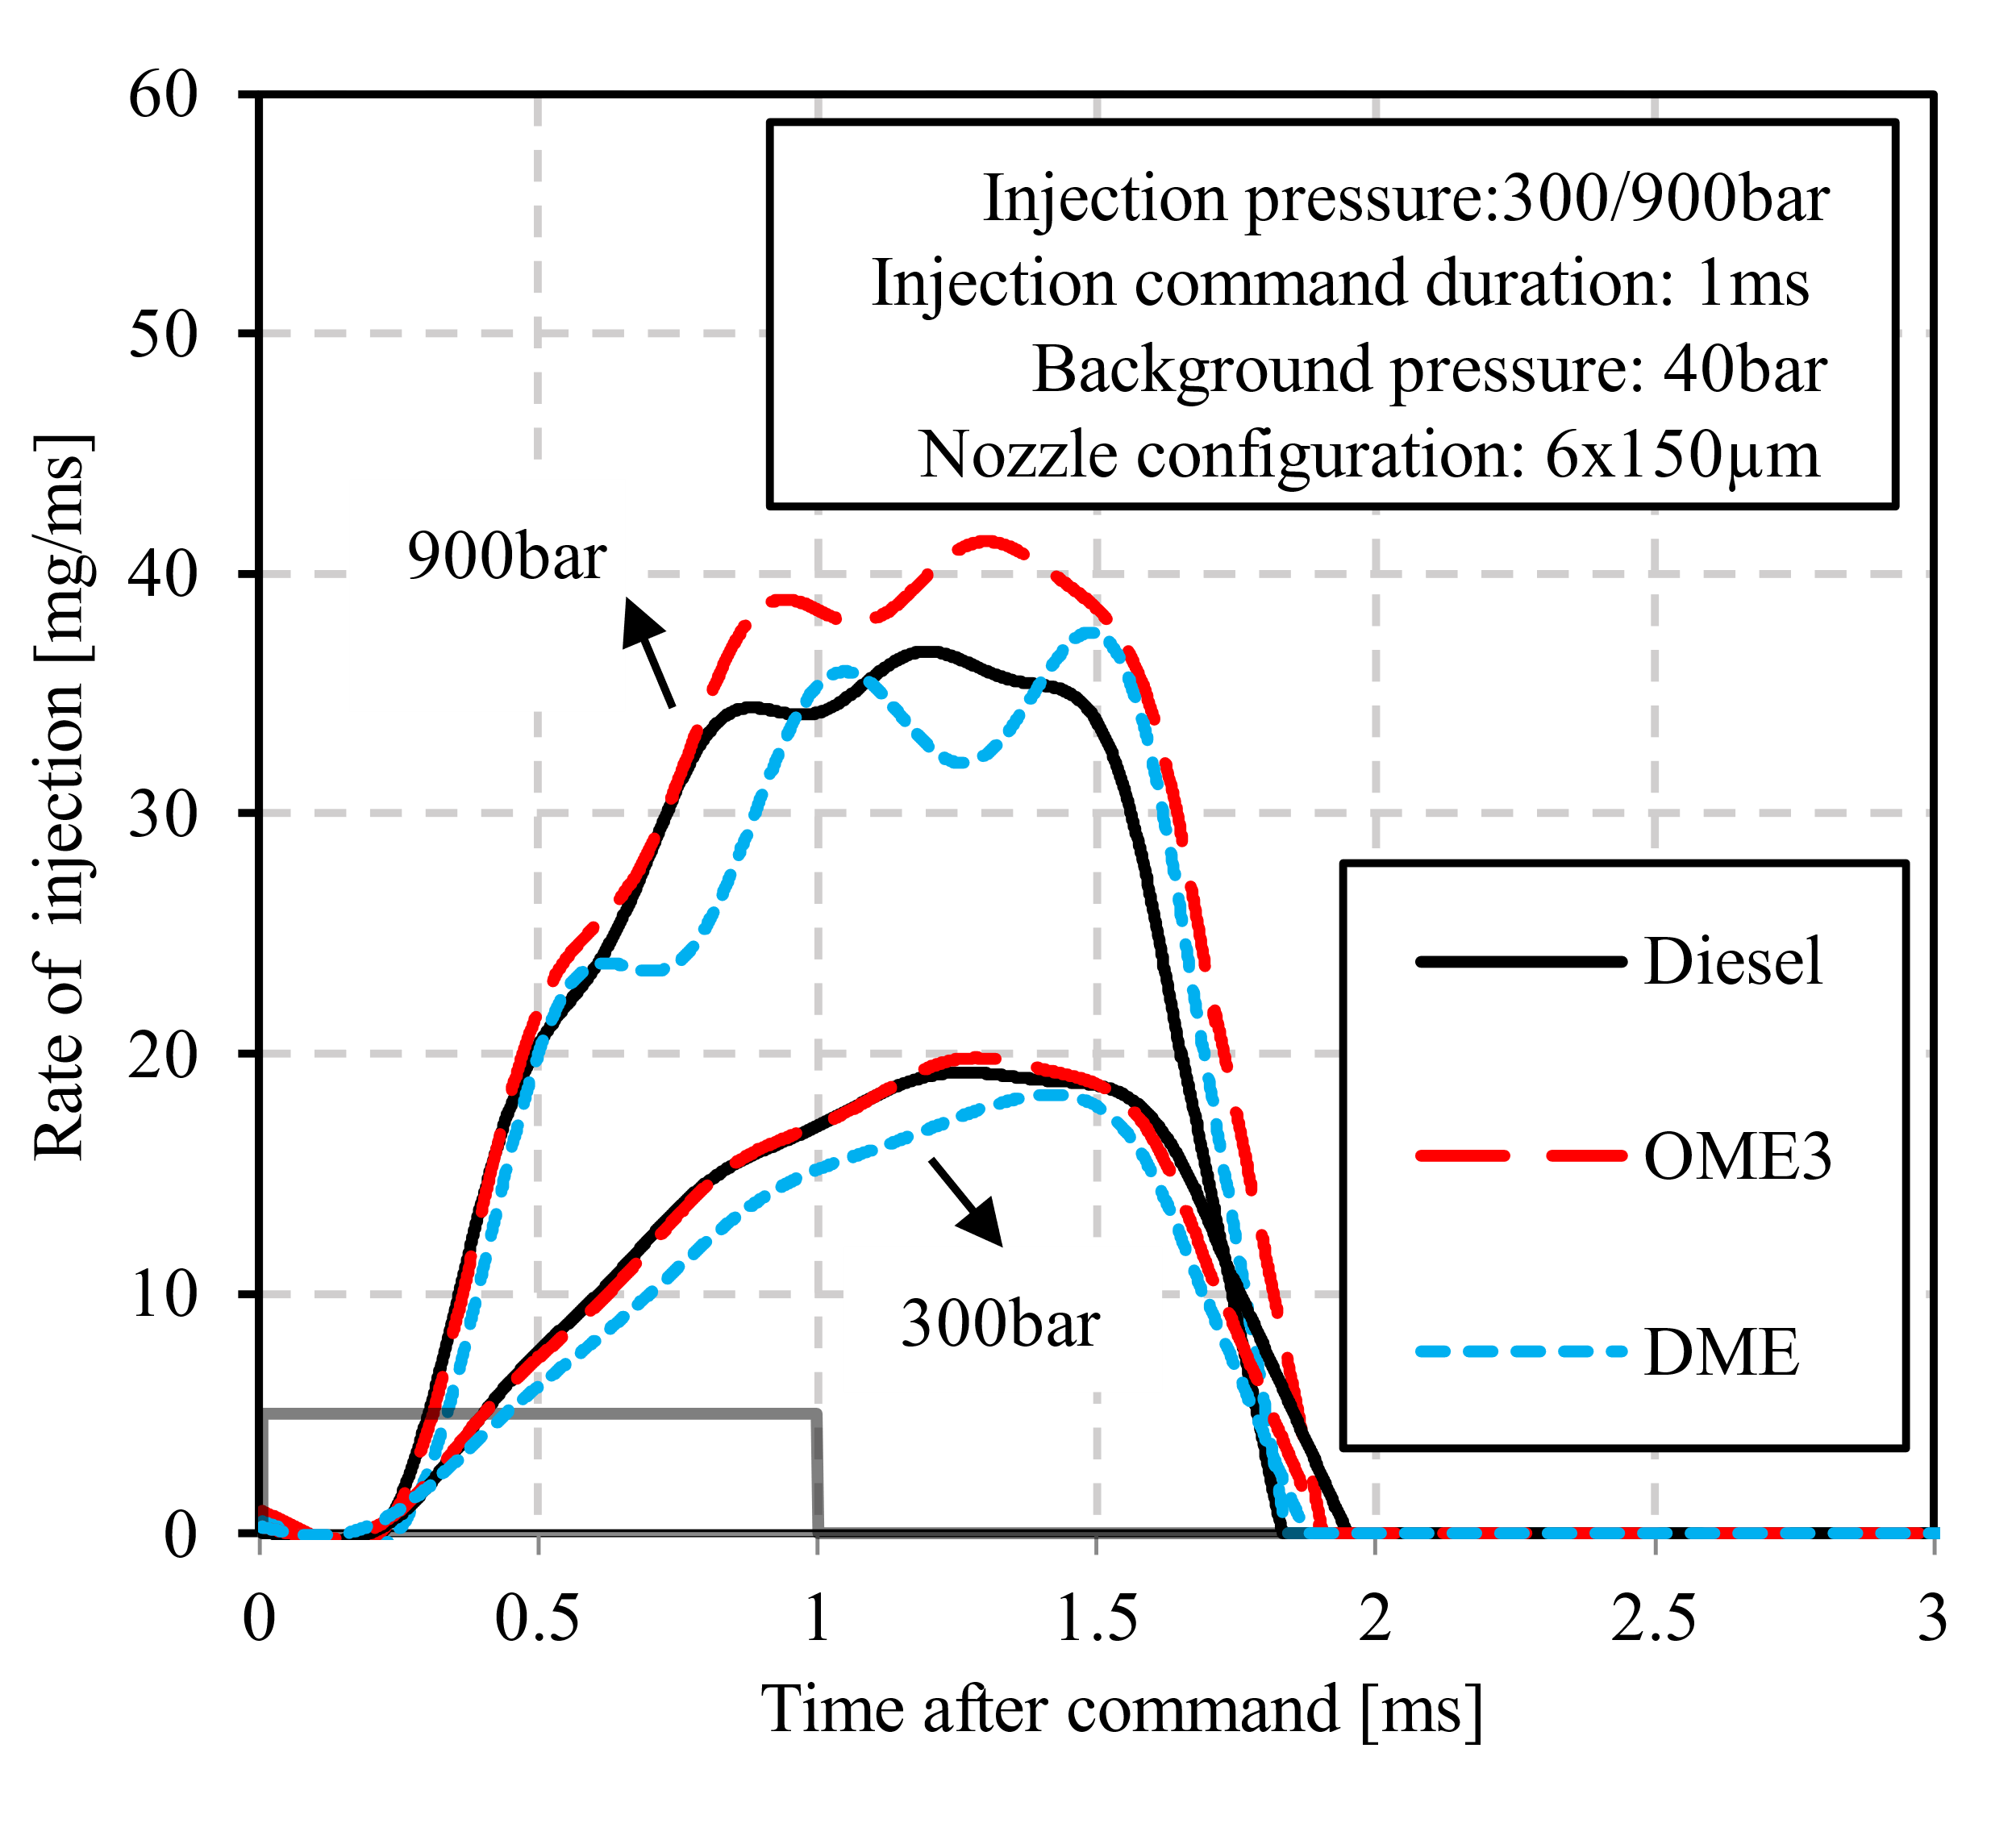
Figure 9. Injection pressure impact on ROI profiles for diesel, OME3, and DME.
3.2. Injection Delays
Figure 10 illustrates the injection duration impact on the opening and closing delay. The opening delay remained consistent across all injection durations. Additionally, all three fuels have a similar opening delay time of around 240 µs. The closing delay for all three fuels initially increased as the injection duration extended but stabilized beyond 700 µs, showing the closing delay has no further dependency on the injection duration. Notably, OME3 exhibited a slightly higher closing delay compared to diesel and DME at injection durations longer than 700 µs, though the difference remained within 50 µs.
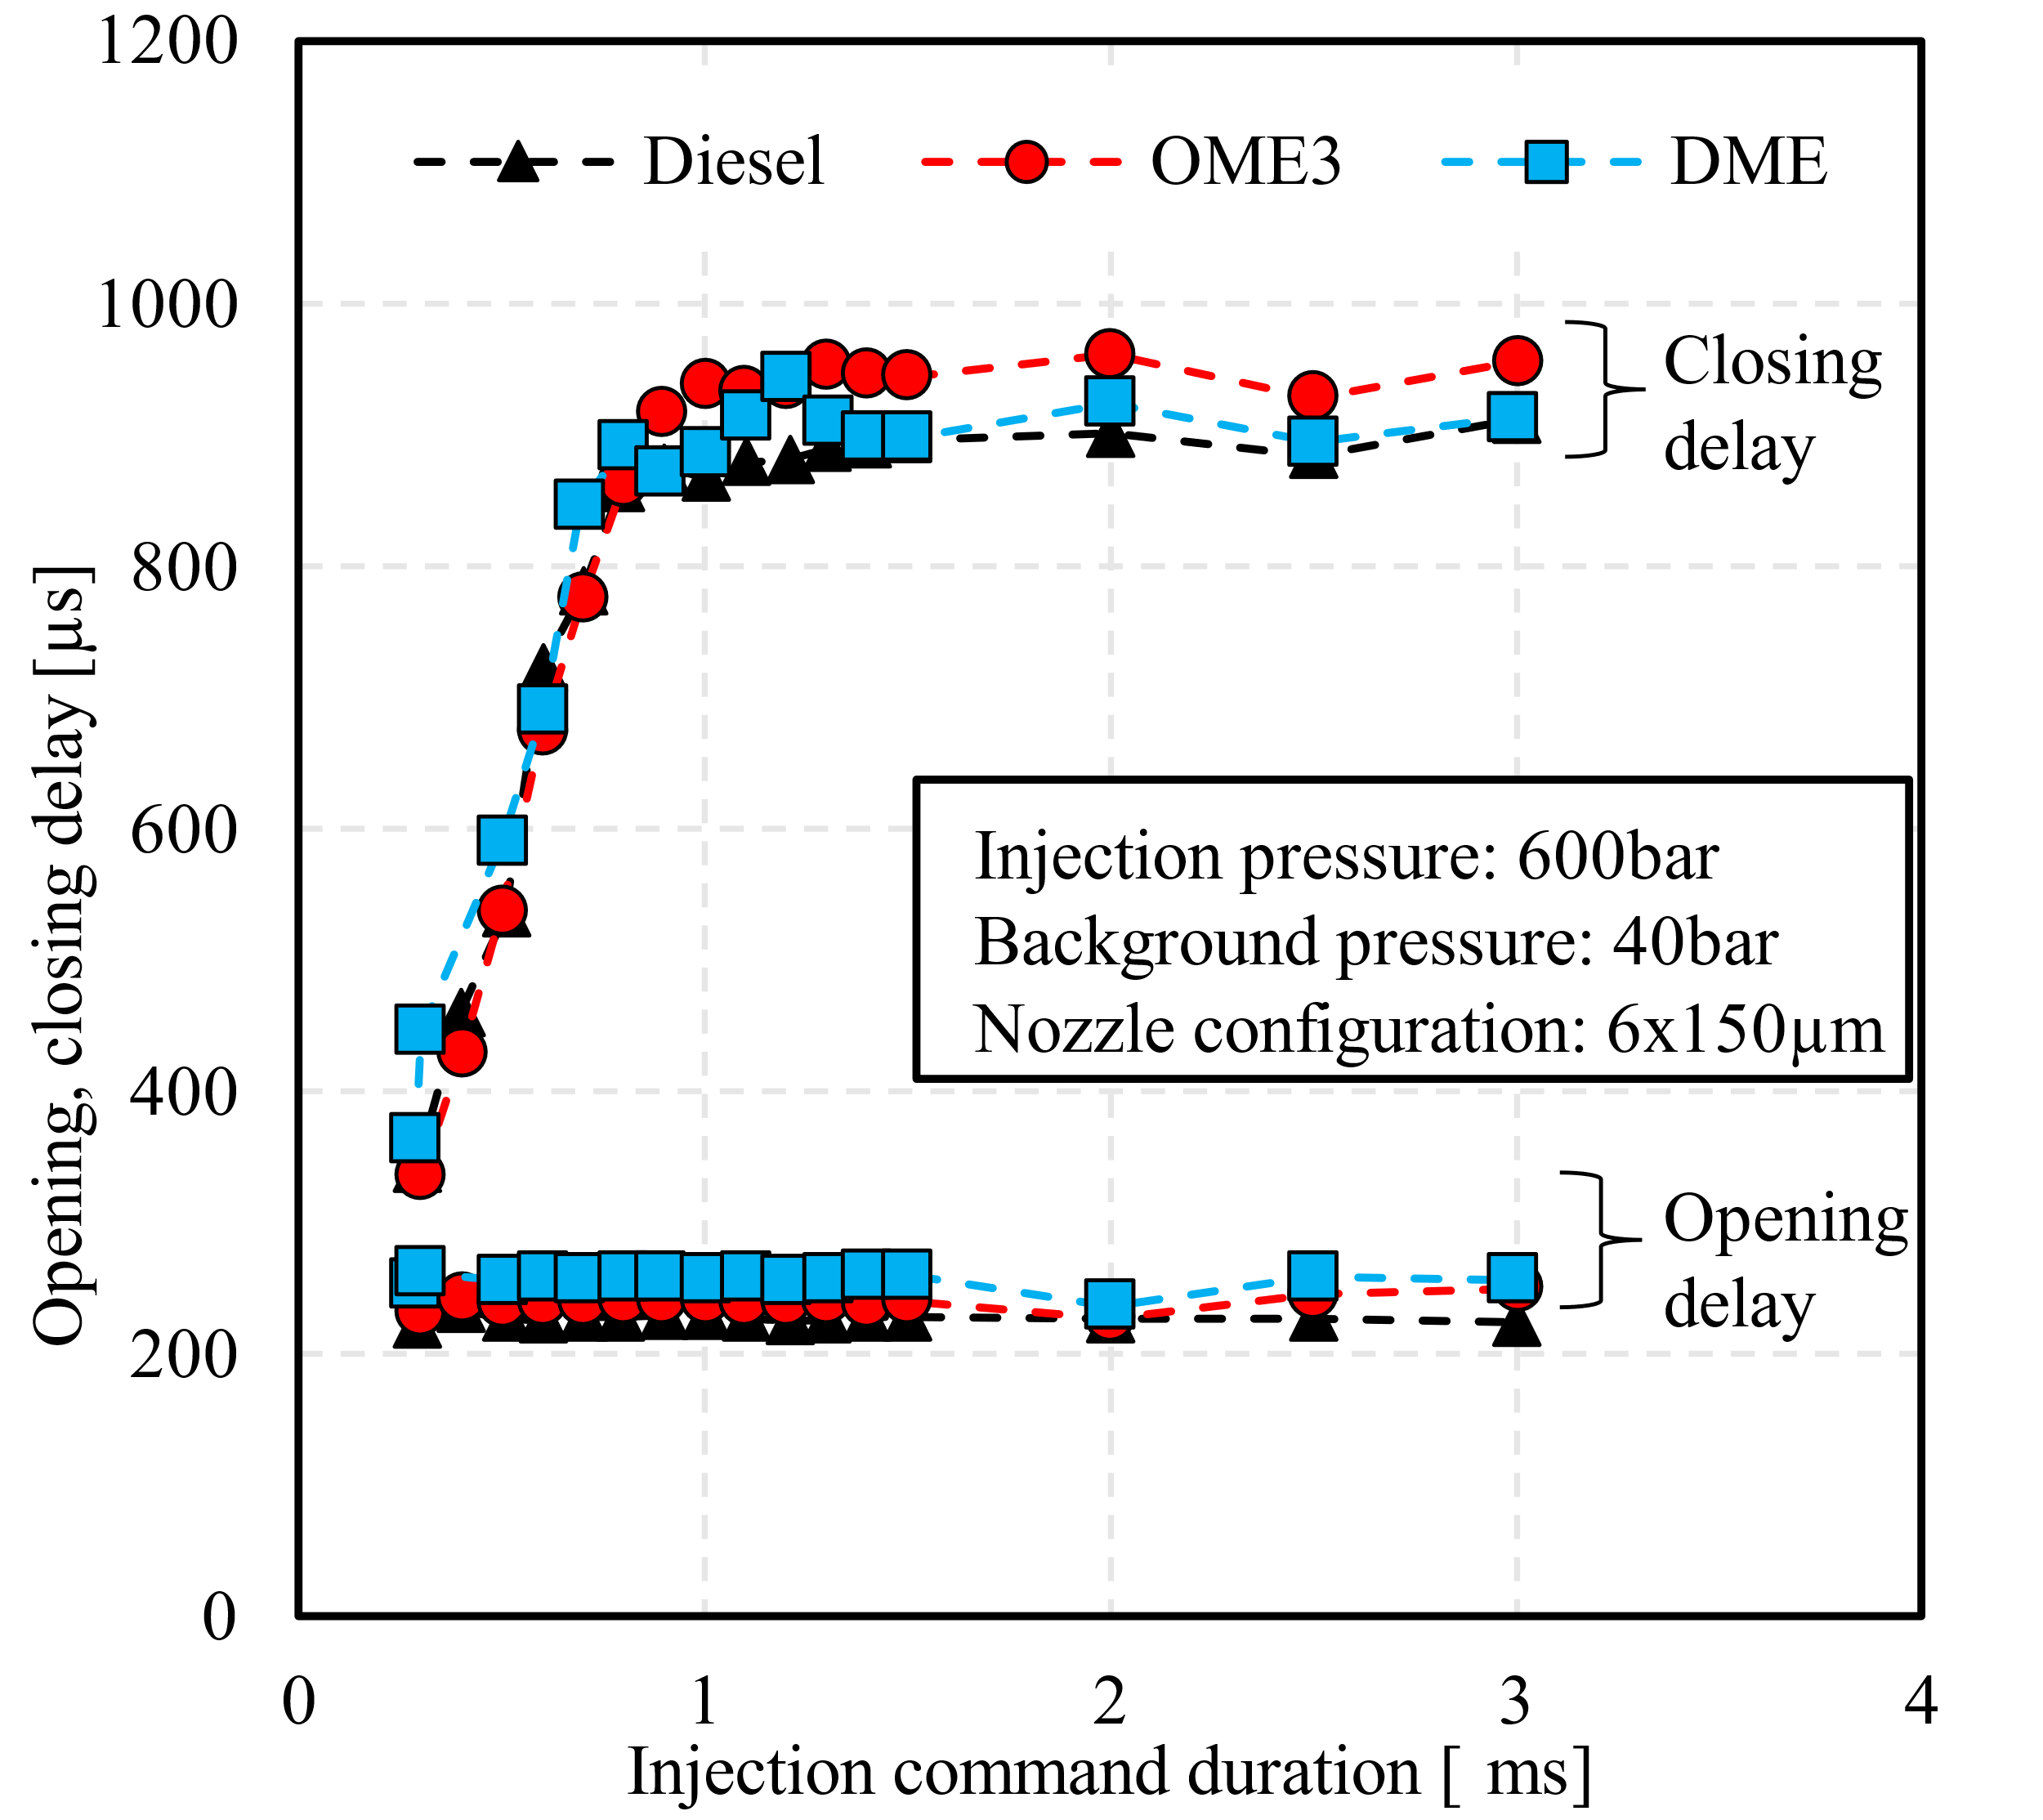
Figure 10. Injection duration impact on opening and closing delay for diesel, OME3, and DME.
Figure 11 illustrates the injection pressure impact on the opening and closing delay. The opening delay remained consistent across all injection pressures, with all three fuels exhibiting similar values of approximately 240 µs. The closing delay showed minor variations, but no clear trend could be established regarding the impact of injection pressure. OME3 exhibited a slightly longer closing delay than diesel and DME at certain conditions, but the differences remained within a small range.
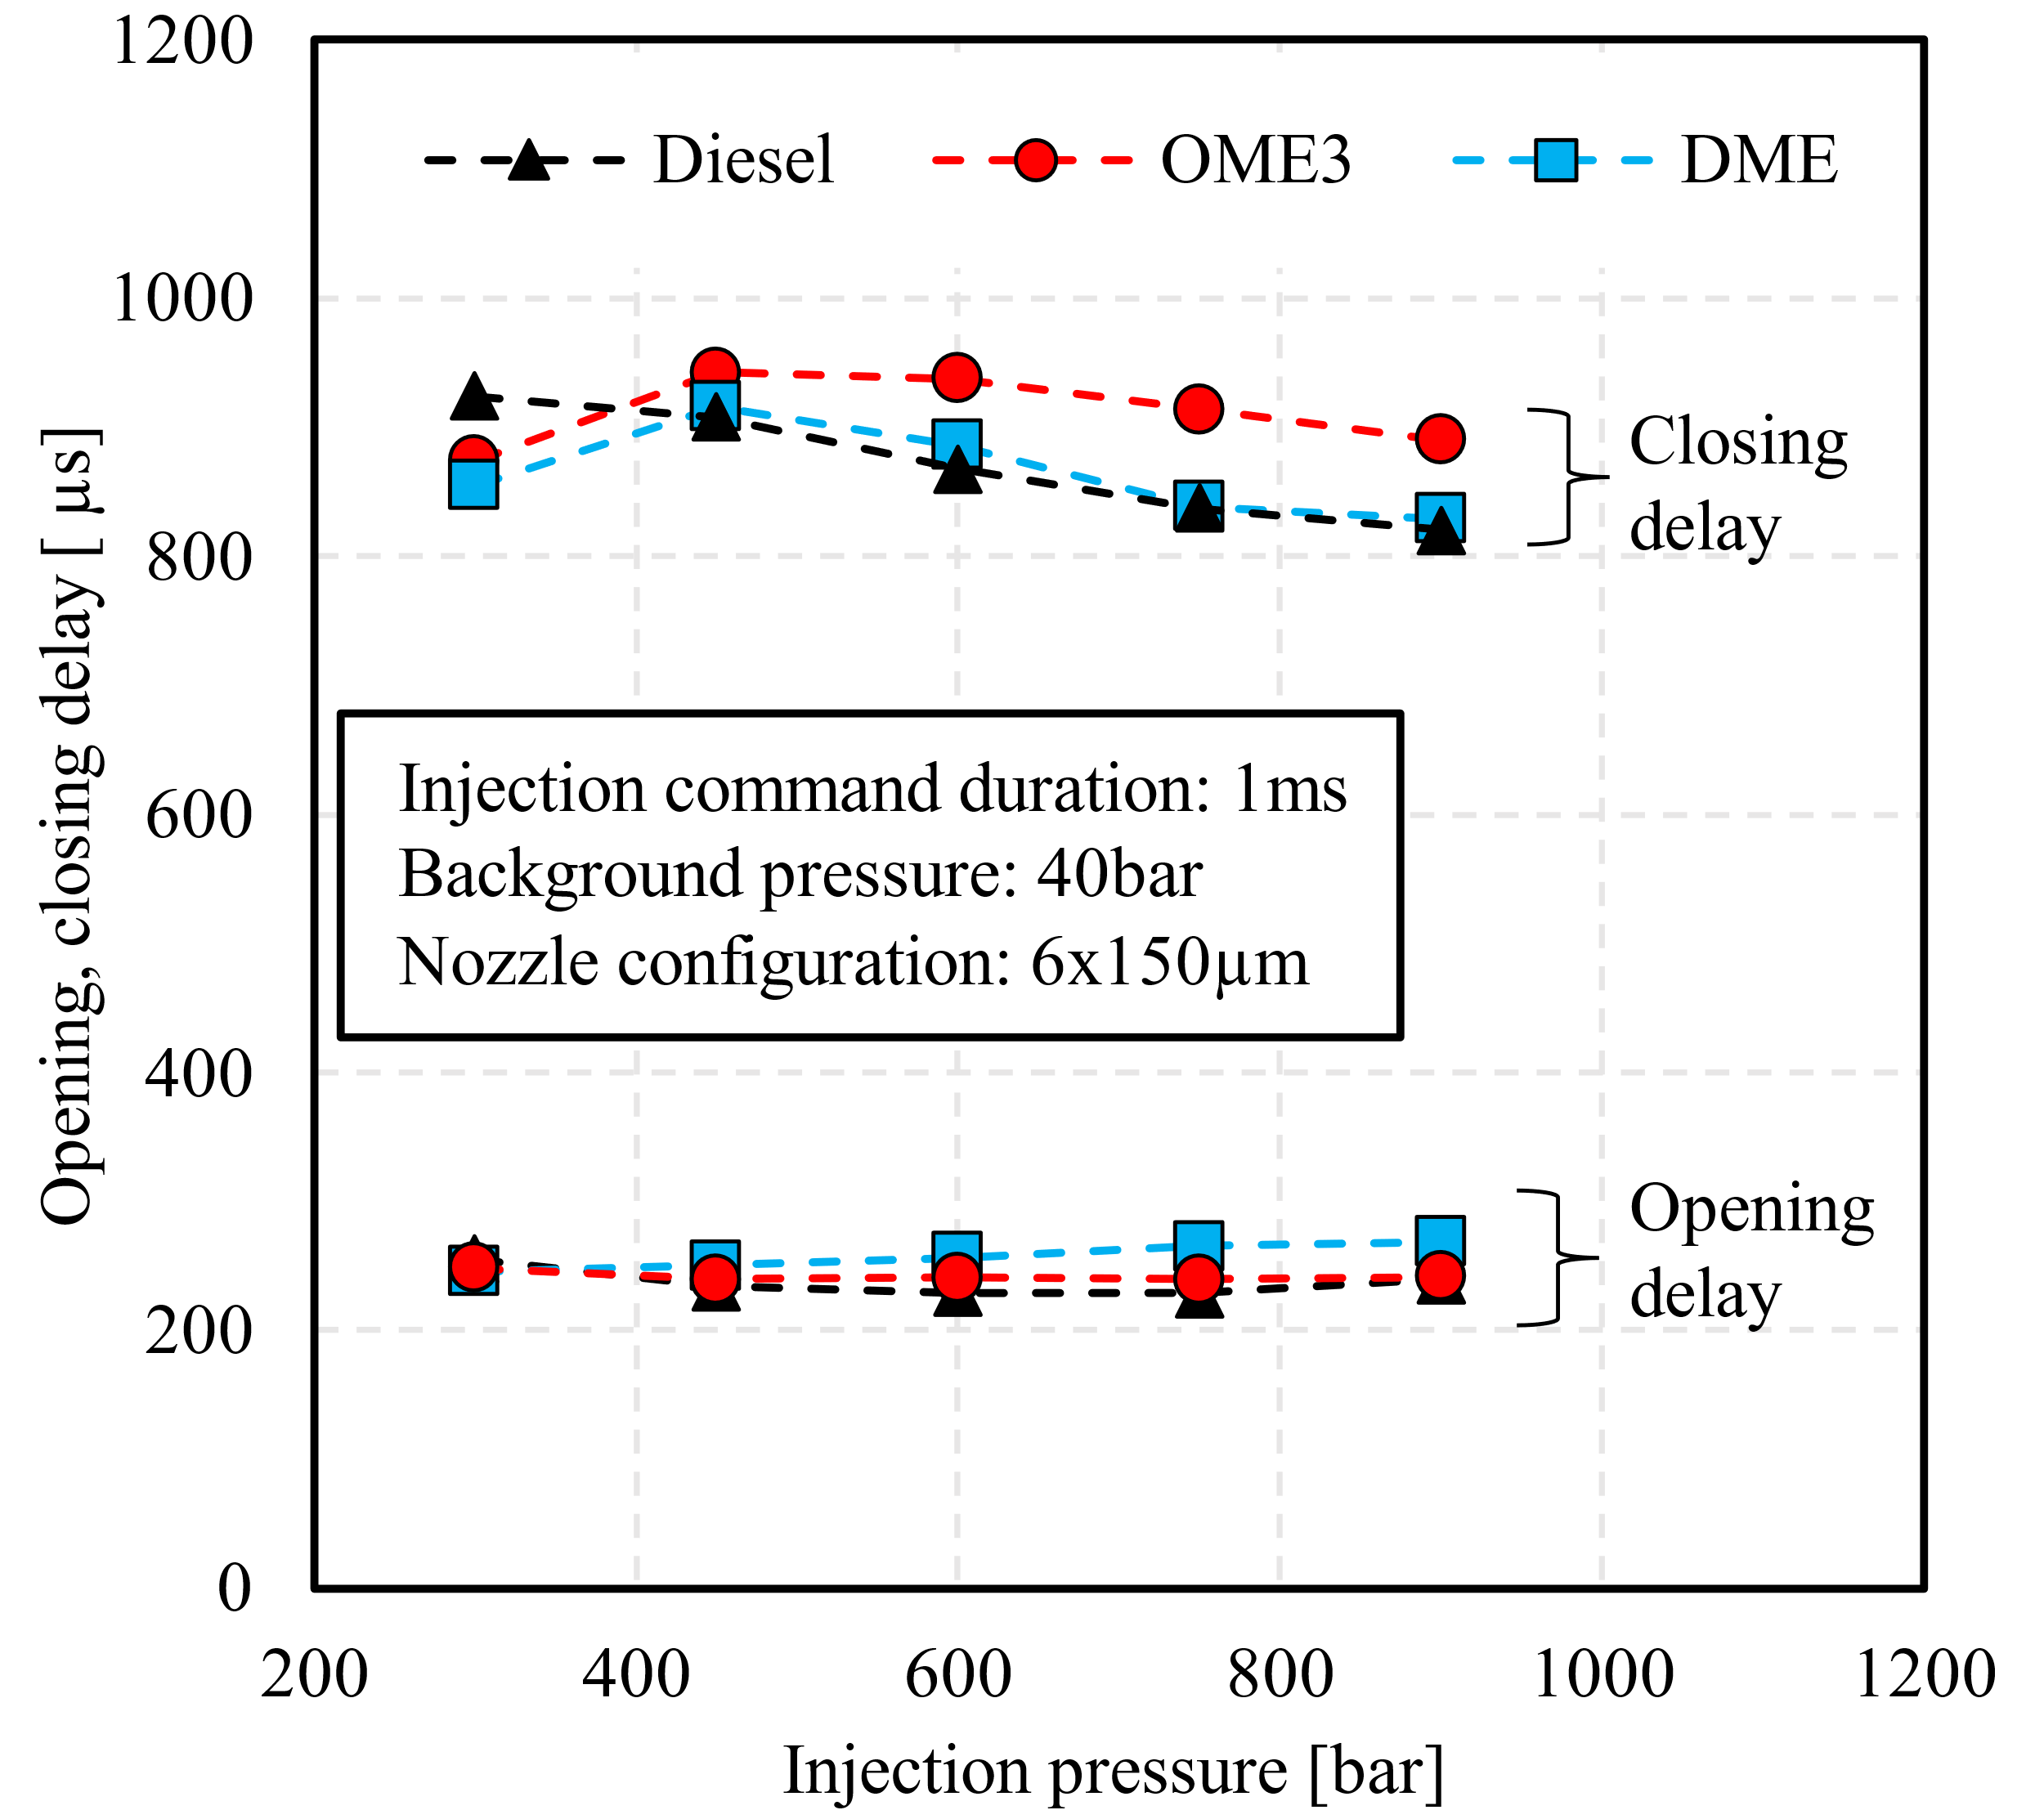
Figure 11. Injection pressure impact on opening and closing delay for diesel, OME3, and DME.
The data presented in this section indicated that the ROI profiles for diesel, OME3, and DME exhibited similar behavior at a 0.5 ms injection duration. As the injection duration and injection pressure increased, the peak ROI for OME3 surpassed that of diesel and DME. Additionally, the injection pressure and injection duration had minimal impact on the opening delay for all three fuels; the differences in opening delay among the three fuels remained within 25 µs. However, at higher injection pressures, the closing delay for OME3 was approximately 80 µs longer than that of diesel and DME.
3.3. Injection Quantity
Figure 12 summarizes the total injection quantity per shot for diesel, OME3, and DME at various injection durations with 300 bar, 600 bar, and 900 bar injection pressure. At 300 bar injection pressure, the injection quantity for all fuels remained similar for injection durations below 700 µs. As the injection duration further increased, differences in injection quantities emerged, with OME3 exhibiting the highest injection quantity and DME the lowest. This trend aligned with the observation from Figure 8, where OME3 showed a higher steady state ROI than diesel and DME at longer injection durations. This increased ROI during steady state for OME3 likely contributed to its higher total injection quantity.
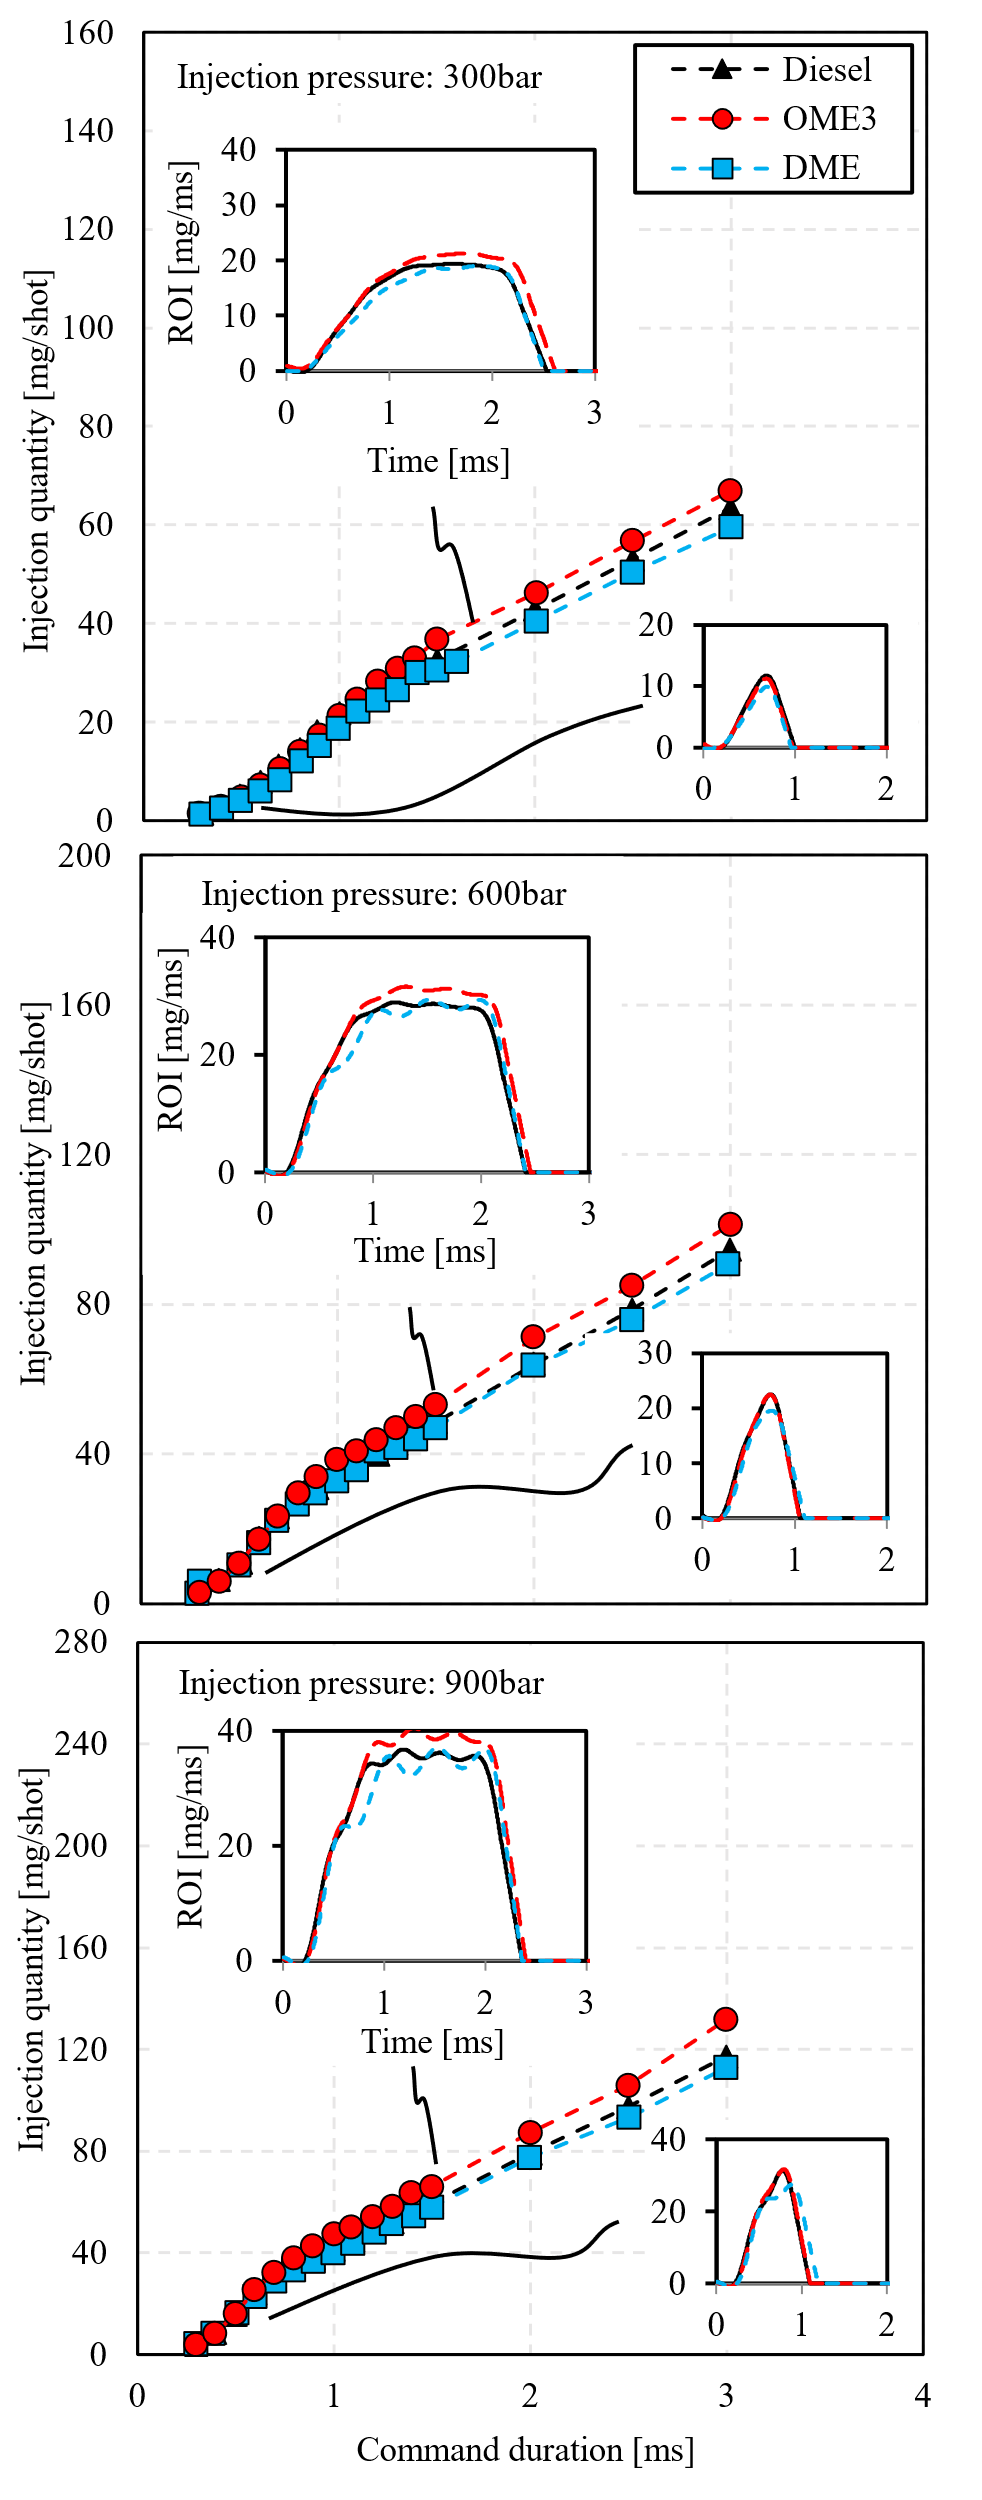
Figure 12. Injection duration impact on injection quantity for diesel, OME3, and DME at 300 bar, 600 bar, and 900 bar.
Similar trends were observed at injection pressures of 600 bar and 900 bar. At injection durations below 700 µs, the injection quantities for diesel, DME, and OME3 remained comparable. However, as the injection duration exceeded 700 µs, OME3 consistently exhibited the highest injection quantity, while DME showed the lowest. Additionally, the differences in total injection quantity became more pronounced with increasing injection pressure. This is attributed to the greater differences in ROI values among the three fuels during the steady-state period at higher injection pressures, as illustrated in Figure 9 in the previous section. A general trend observed from these plots is that at short injection durations, the ROI profiles for all three fuels were similar, resulting in comparable total injection quantities. As the injection duration increased and a steady state ROI was established, differences in the steady state ROI contributed to the variation in total injection quantities. It is worthwhile to mention that the observation agreed with the finding from [13], where at short energizing durations, both fuels delivered similar quantities. However, as the energizing duration increased, diesel showed a higher injected amount.
Figure 13 presents the ROI profile for DME at 600 bar injection pressure and 2 ms injection duration. This figure illustrates the contribution of different stages to the total injection quantity. At this injection duration, 70% of the fuel was delivered during the steady state period. Consequently, the ROI value during the steady state period had the most significant impact on the total injection quantity. This observation explains why OME3 exhibited a higher total injection quantity compared to diesel and DME at longer injection durations—the ROI value for OME3 was consistently higher during the steady-state period.
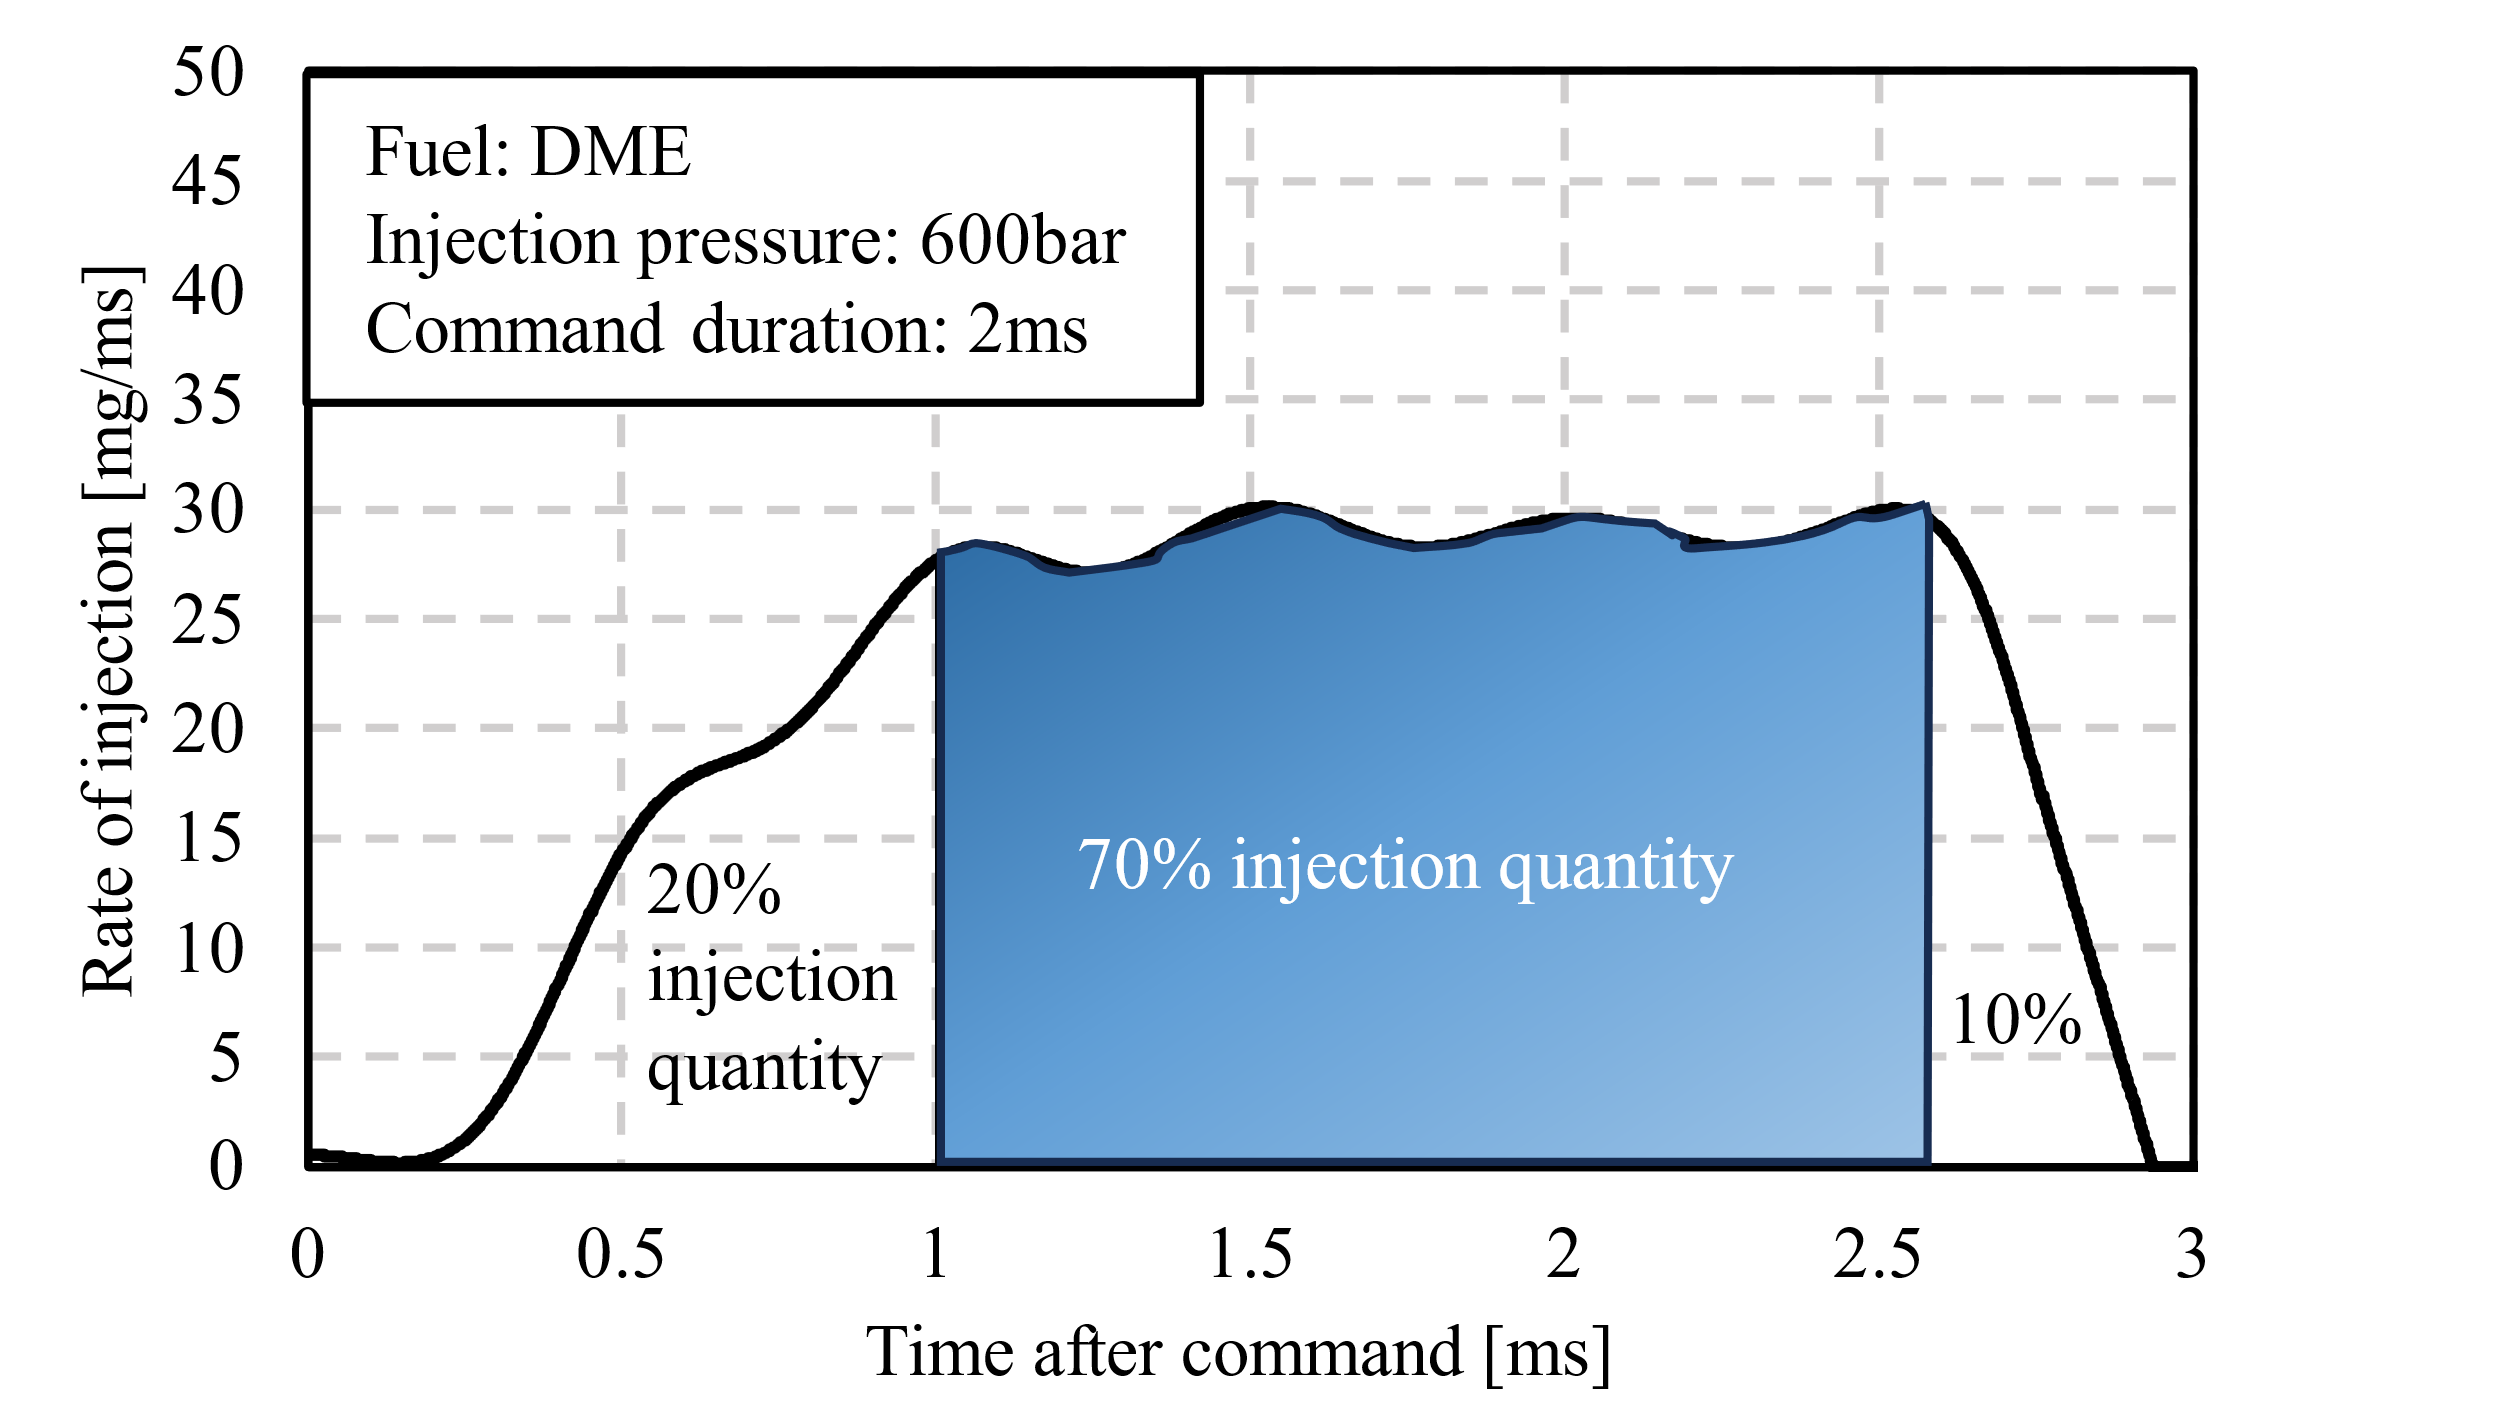
Figure 13. Contribution of different stages to the total injection quantity.
To further explore the impact of fuel properties on the ROI during the steady state period, the discharge coefficient was calculated by dividing the measured mass flow rate by the theoretical mass flow rate:
This coefficient provides insights into the injector’s flow characteristics. Higher values typically indicate more efficient fuel flow through the nozzle, while lower values suggest greater flow resistance. In the following sections, the variations in for diesel, DME, and OME3 under different injection pressures will be analyzed to better understand the fuel-specific influences on the ROI profiles.
The theoretical mass flow rate is derived from the combination of the continuity equation and Bernoulli’s equation with the assumption of negligible inlet velocity:
where is the pressure difference (i.e., injection pressure—back pressure), is the fuel density at the operating temperature, is the geometric cross-sectional area of the orifice, and is the number of orifices on the nozzle.
The measured mass flow rate was averaged during the steady state period as illustrated in Figure 14. To ensure more accurate calculations and minimize errors caused by pressure fluctuations, the injection duration was extended to 3 ms. This longer duration provided a stable measurement window, allowing for a more reliable assessment of the discharge coefficient.
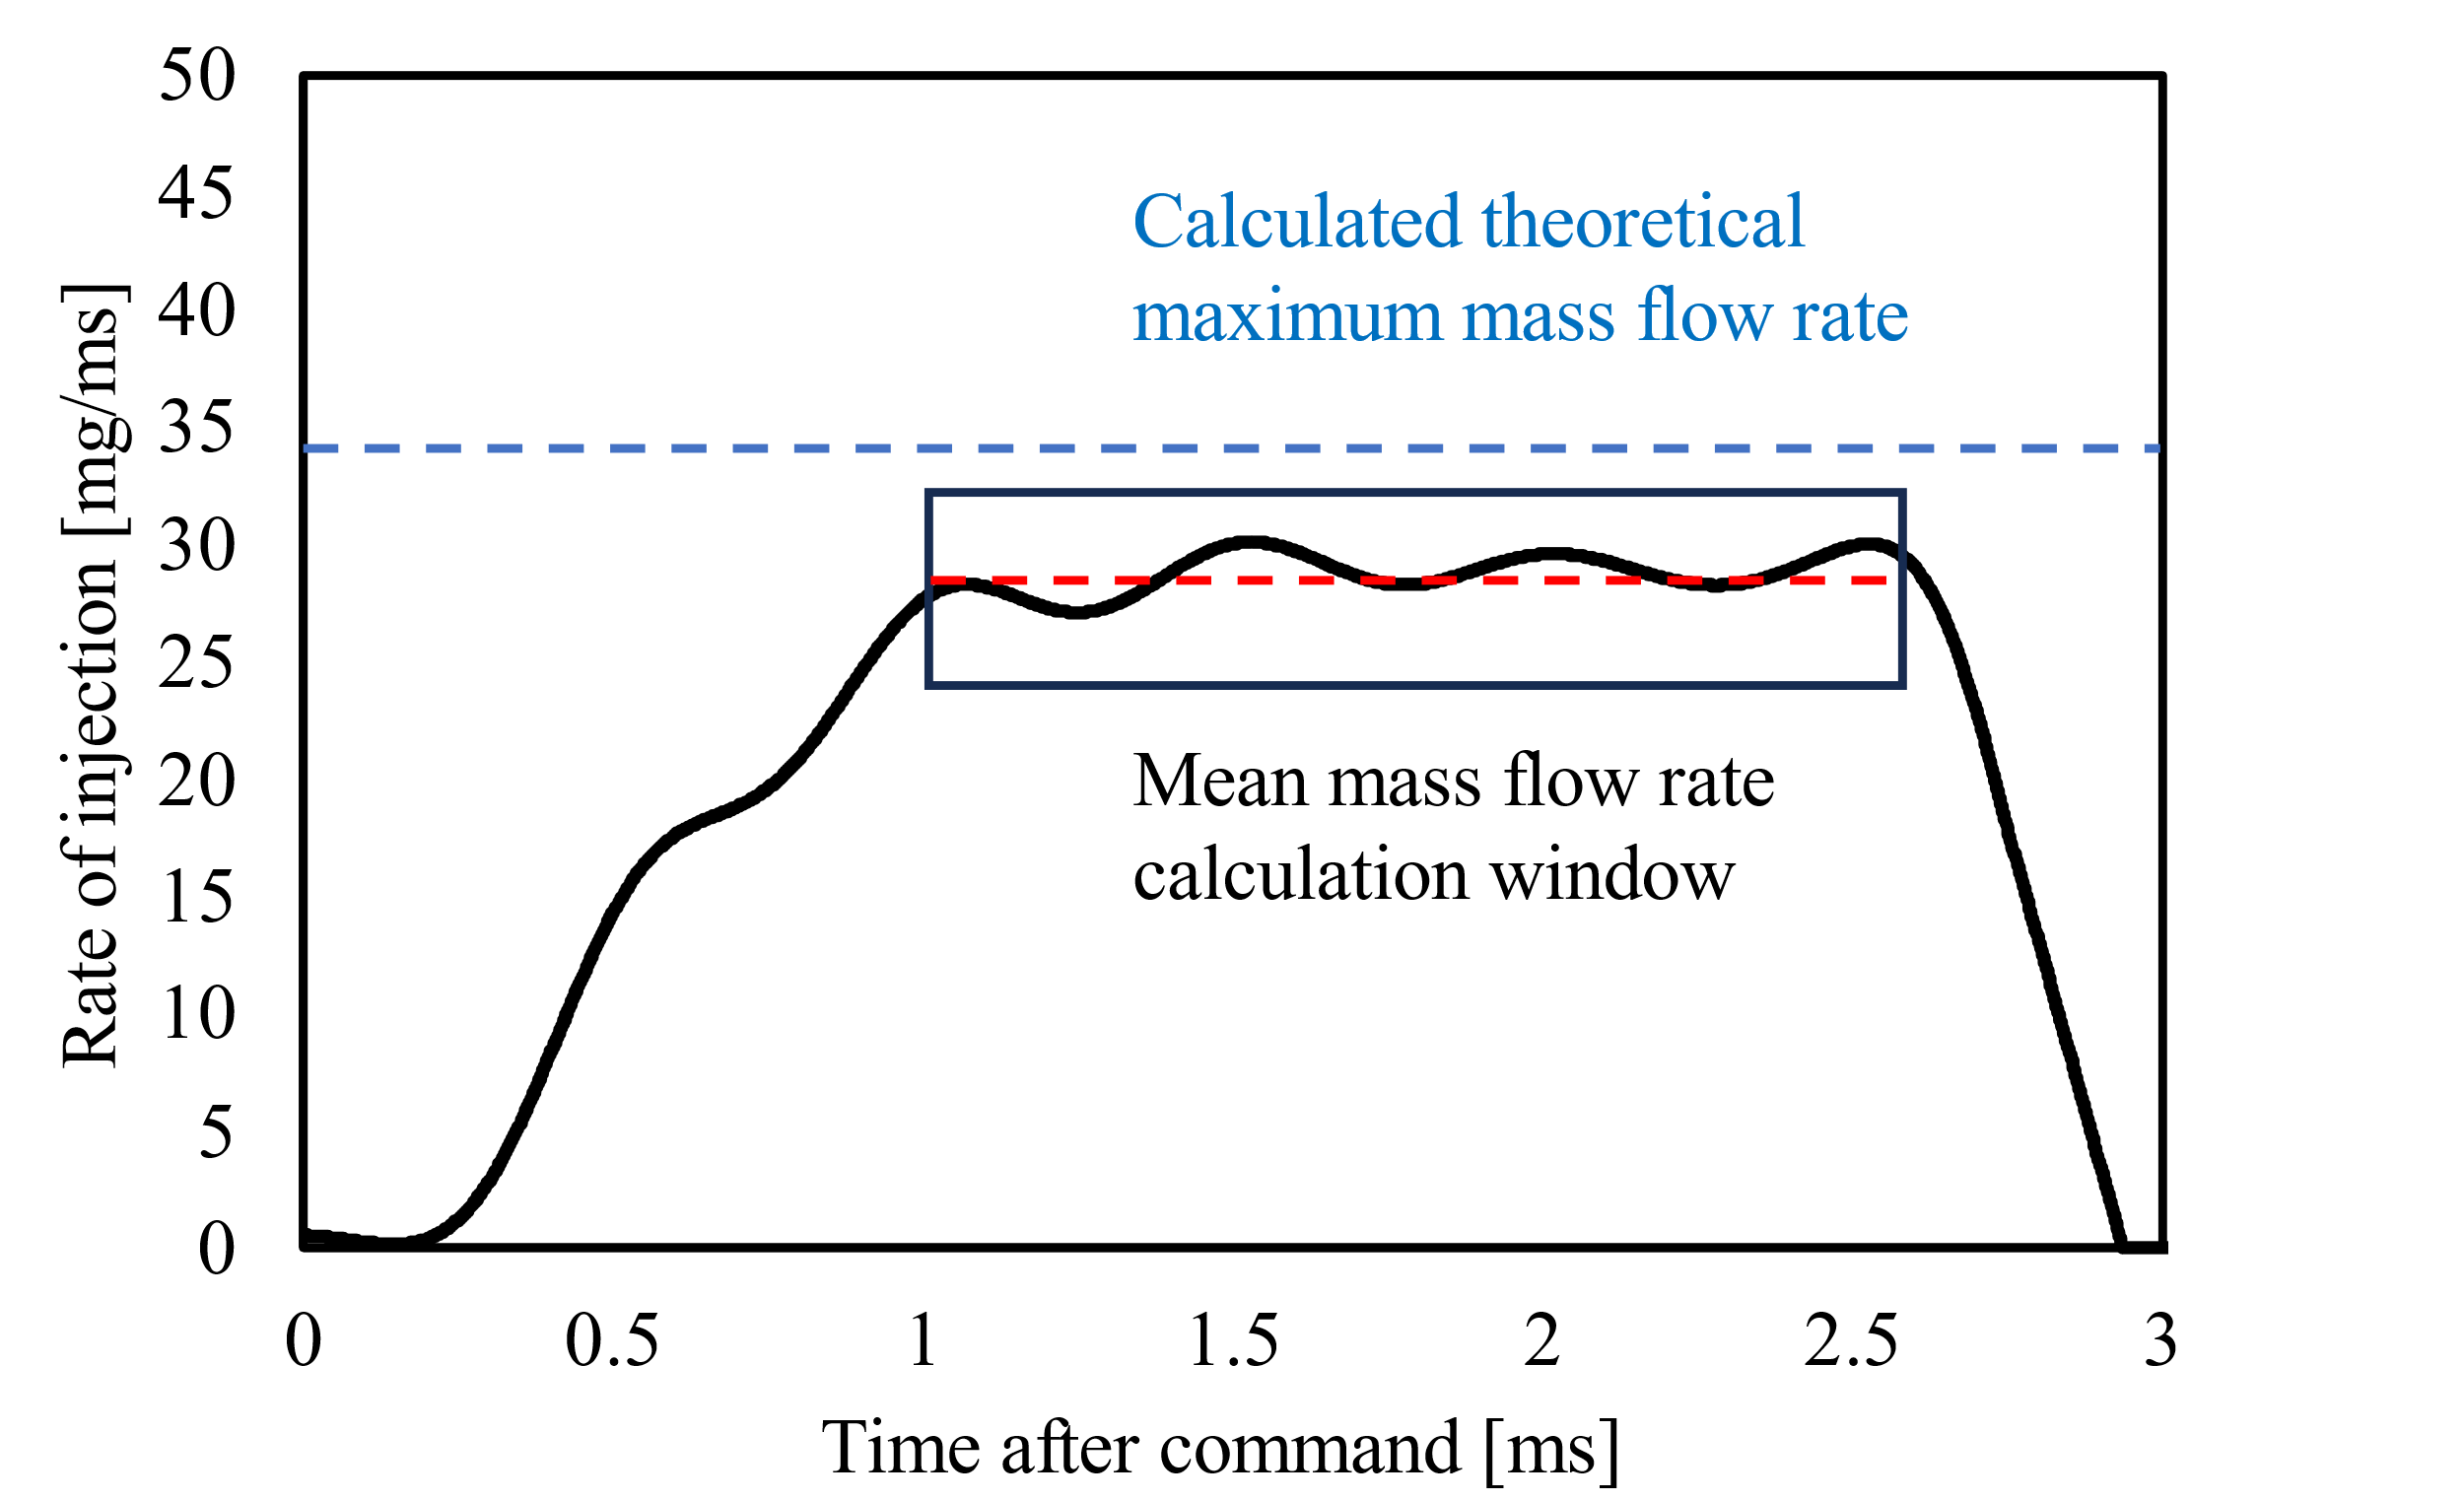
Figure 14. Averaged mass flow rate calculation during the steady state period.
Figure 15 shows the impact of injection pressure on the discharge coefficient for diesel, OME3, and DME. The discharge coefficient increased as the injection pressure increased. It is worthwhile to mention that the observation agreed with the findings from [20]. This trend is characteristic of a flow through nozzles with conical orifices, suggesting a reduction in cavitation effects at higher injection pressures [20].
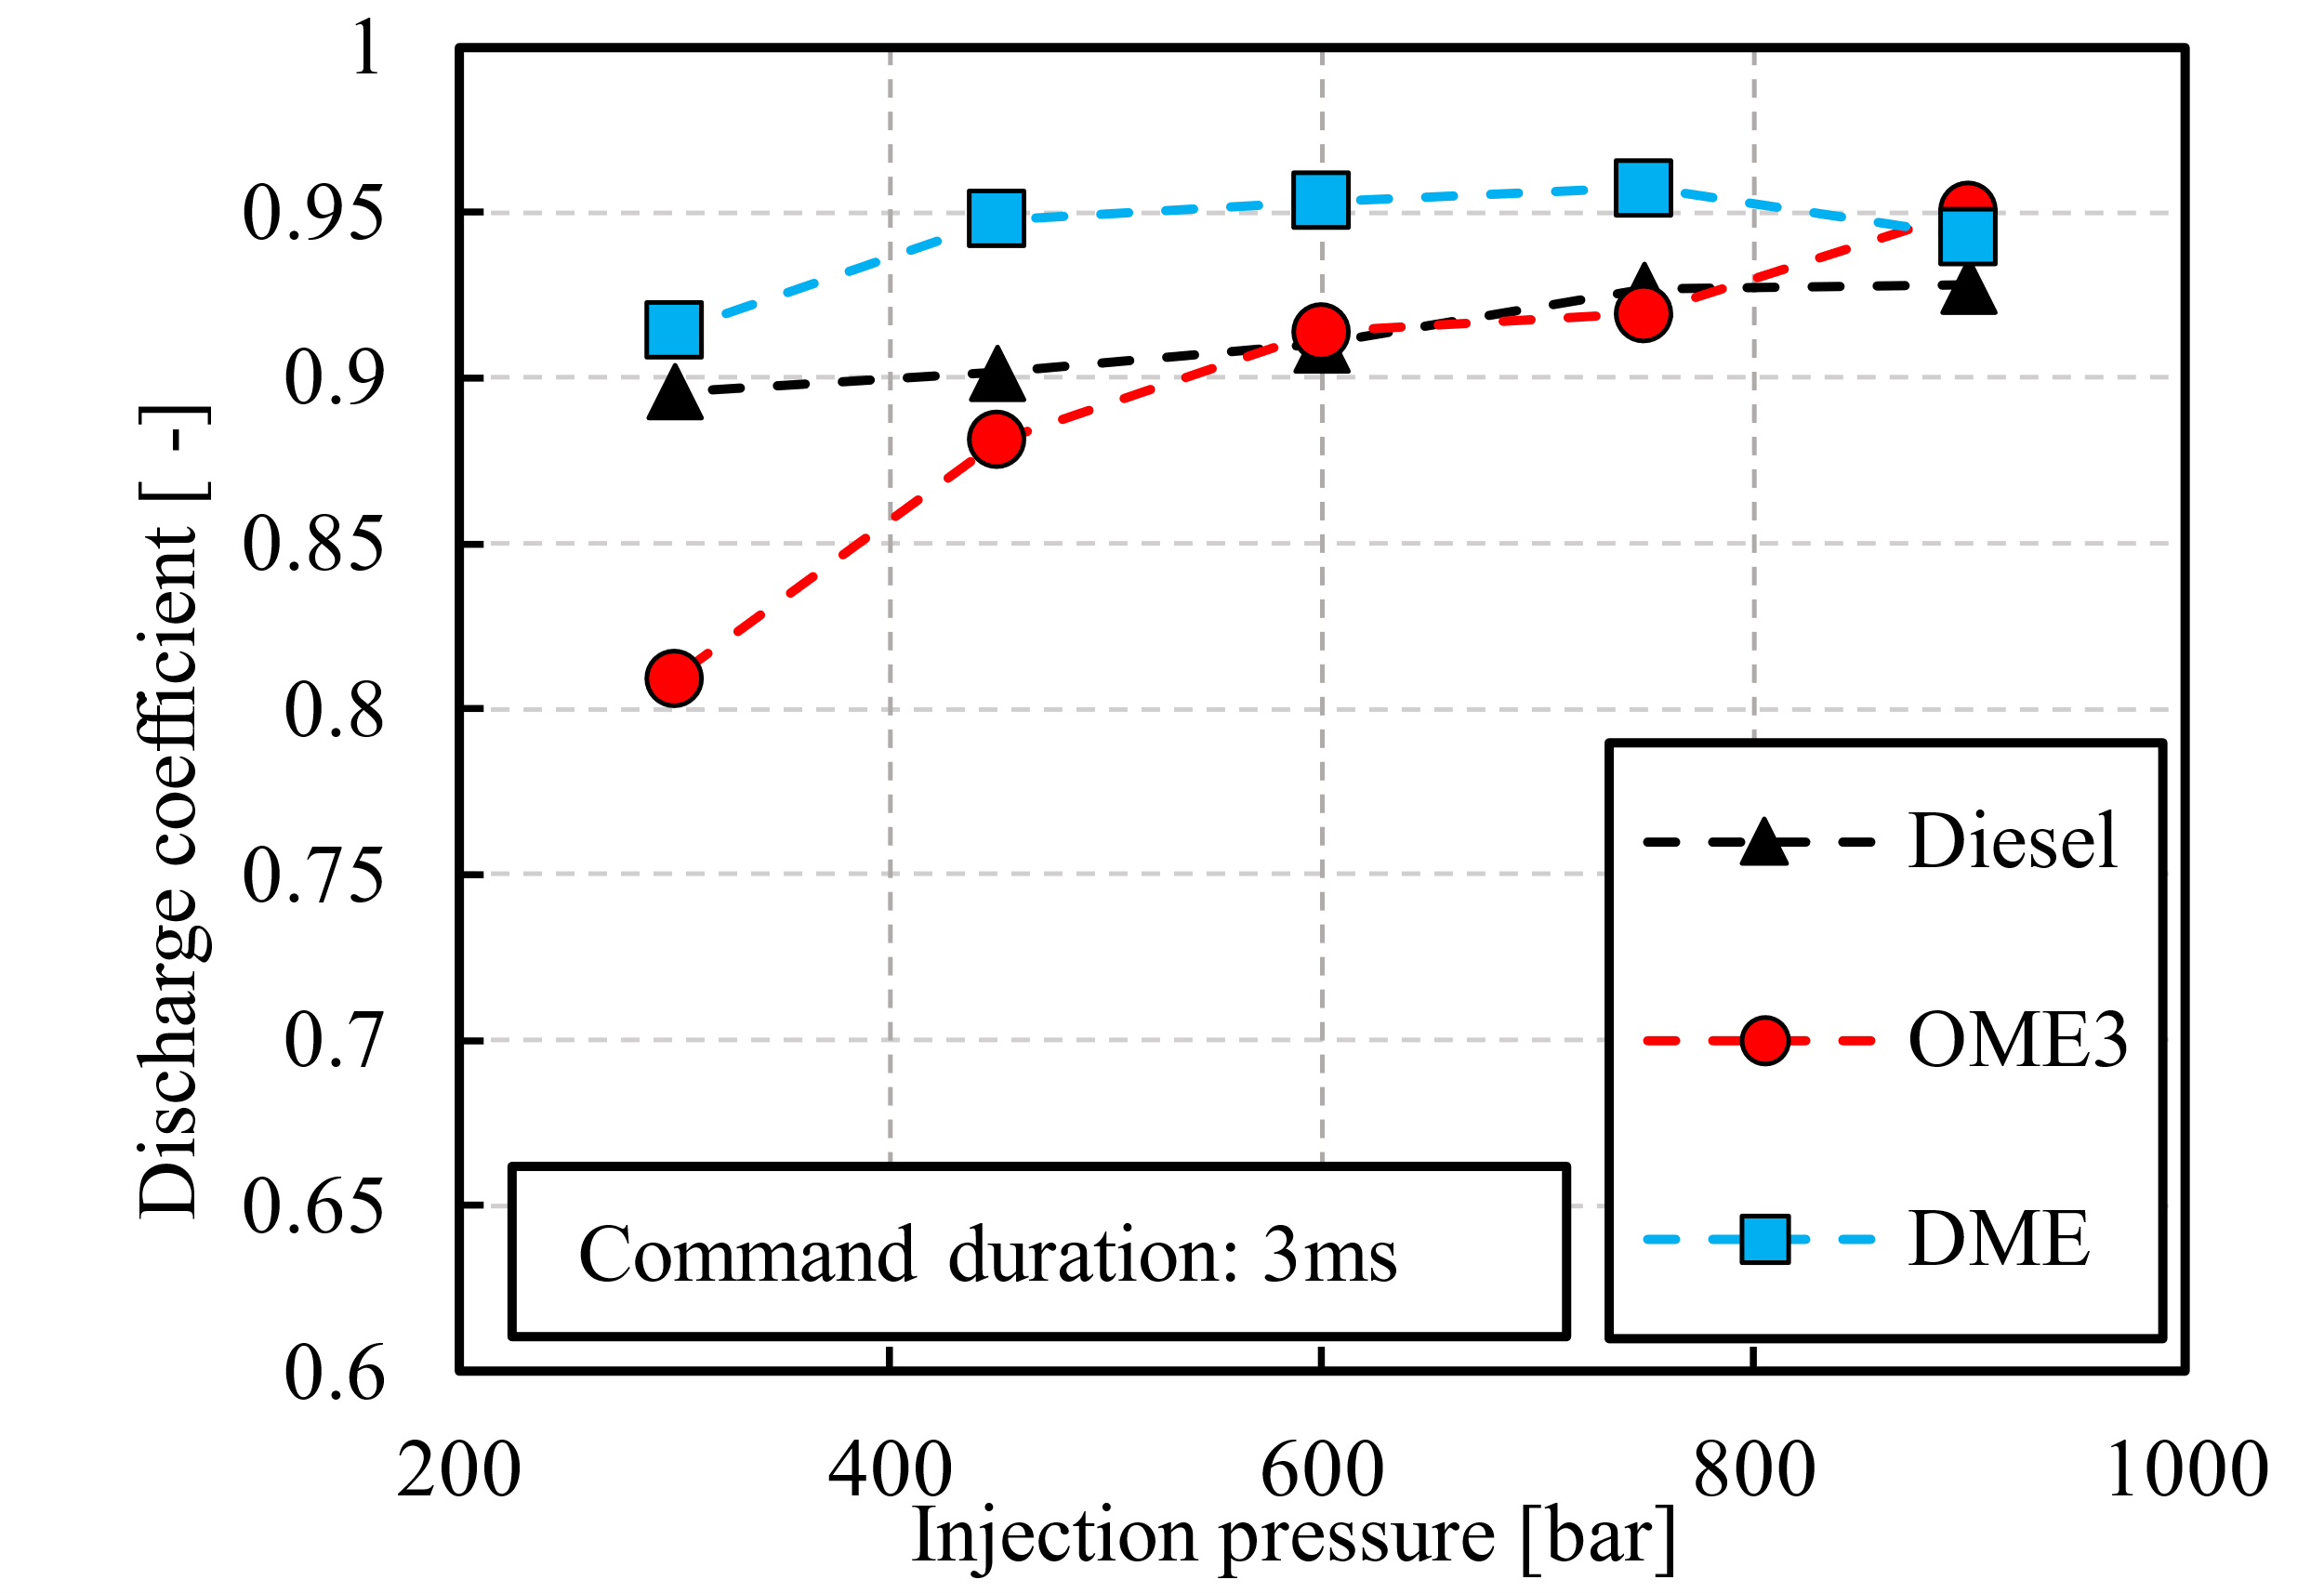
Figure 15. Impact of injection pressure on the discharge coefficient for diesel, OME3, and DME.
The discharge coefficient for OME3 is less than diesel and DME at a 300 bar injection pressure condition. The smaller discharge coefficient for OME3 at this injection pressure is likely owing to its high viscosity [21]. The difference in discharge coefficient among the three fuels diminished as the injection pressure increased. At 900 bar injection pressure, the difference in discharge coefficient for the three fuels becomes marginal. This convergence indicated that at high injection pressure, the discharge coefficient for different fuels was similar, hence the volumetric flow rate. Consequently, the primary factor influencing the mass flow rate was the fuel density. Fuels with higher densities achieve greater steady-state mass flow rates under this condition.
4. Conclusions
The ROI profiles for diesel, OME3, and DME were compared at various injection pressures and injection durations. Additionally, the injection pressure and injection duration impact on the injection delay and injection quantity were also investigated. The key conclusions are as follows:
● At injection durations below 700 µs, the ROI profile did not reach a steady state period. The ROI profiles for all three fuels exhibited similarly, regardless of the injection pressure.
● At injection durations above 700 µs, the steady state period was observed in the ROI profile. During this period, OME3 showed the highest ROI while DME showed the lowest ROI. Furthermore, the difference in ROI during the steady state period became more pronounced with increasing injection pressure.
● The opening delay remained consistent across all three fuels. However, OME3 showed a slightly longer closing delay when the injection duration exceeded 700 µs.
● The discharge coefficient among the three fuels showed great differences at low injection pressure, with OME3 showing the lowest discharge coefficient. As injection pressure increased, the differences in the discharge coefficients among the fuels diminished. At 900 bar injection pressure, the difference in discharge coefficient for the three fuels becomes marginal. Consequently, at high injection pressures, fuel density played a dominant role in determining the ROI.
Author Contributions: S.L.: Methodology, investigation, software, data curation, formal analysis, writing and editing; B.C.: Methodology, investigation, data curation, writing and editing; X.Y., M.Z.: Formal analysis, writing-review and editing, supervision, project administration, funding acquisition. All authors have read and agreed to the published version of the manuscript.
Funding: This research was partially supported by NSERC/IRC, NSERC/CRD, NSERC/RTI, NSERC/DG, CFI/ORF, MITACS, and the University of Windsor.
Institutional Review Board Statement: Not applicable.
Informed Consent Statement: Not applicable.
Data Availability Statement: Not applicable.
Acknowledgments: This work is partially supported by NSERC/IRC, NSERC/CRD, NSERC/RTI, NSERC/DG, CFI/ORF, Mitacs, and the University of Windsor. A special thanks to Ford Motor Company of Canada and other OEM partners for their collaborative effort and technical support.
Conflicts of Interest: The authors declare no conflict of interest.
References
- Tan, Y.; Kou, C.; Ning, D.; E, J.; Feng, C. Effects of the structure parameters on methane emission control of an adsorptive three-way catalytic converter during cold start of the heavy-duty natural gas engines. Energy 2025, 317, 134654. https://doi.org/10.1016/j.energy.2025.134654.
- Tan, Y.; E, J.; Kou, C.; Feng, C.; Han, D. Effects of critical structure parameters on conversion performance enhancement of a Pd–Rh dual-carrier catalytic converter for heavy-duty natural gas engines. Energy 2024, 303, 131934. https://doi.org/10.1016/j.energy.2024.131934.
- Zheng, M.; Reader, G.T.; Hawley, J.G. Diesel engine exhaust gas recirculation—A review on advanced and novel concepts. Energy Convers. Manag. 2004, 45, 883–900. https://doi.org/10.1016/S0196-8904(03)00194-8.
- Arcoumanis, C.; Bae, C.; Crookes, R.; Kinoshita, E. The potential of di-methyl ether (DME) as an alternative fuel for compression-ignition engines: A review. Fuel 2008, 87, 1014–1030. https://doi.org/10.1016/j.fuel.2007.06.007.
- Park, S.H.; Lee, C.S. Applicability of dimethyl ether (DME) in a compression ignition engine as an alternative fuel. Energy Convers. Manag. 2014, 86, 848–863. https://doi.org/10.1016/j.enconman.2014.06.051.
- LeBlanc, S.; Cong, B.; Sandhu, N.; Jin, L.; Yu, X.; Zheng, M. Combustion management of neat dimethyl ether combustion for enabling high efficiency and low NOx production. Int. J. Automot. Manuf. Mater. 2024, 3, 2.
- Fleisch, T.; McCarthy, C.; Basu, A.; Udovich, C.; Charbonneau, P.; Slodowske, W.; Mikkelsen, S.-E.; McCandless, J. A New Clean Diesel Technology: Demonstration of ULEV Emissions on a Navistar Diesel Engine Fueled with Dimethyl Ether; SAE Technical Paper 950061; SAE International: Warrendale, PA, USA, 1995. https://doi.org/10.4271/950061.
- Sato, Y.; Nozaki, S.; Noda, T. The Performance of a Diesel Engine for Light Duty Truck Using a Jerk Type in-Line DME Injection System; SAE Technical Paper 2004-01-1862; SAE International: Warrendale, PA, USA, 2004. https://doi.org/10.4271/2004-01-1862.
- Dimitriou, P.; Peng, Z.; Wang, W.; Gao, B.; Wellers, M. Effects of advanced injection strategies on the in-cylinder air–fuel homogeneity of diesel engines. Proc. Inst. Mech. Eng. Part D J. Automob. Eng. 2015, 229, 330–341. https://doi.org/10.1177/0954407014540900.
- Bai, F.; Zhang, Z.; Du, Y.; Zhang, F.; Peng, Z. Effects of injection rate profile on combustion process and emissions in a diesel engine. J. Combust. 2017, 2017, 9702625. https://doi.org/10.1155/2017/9702625.
- Niculae, A.L.; Chiriac, R.; Racovitza, A. Effects of injection rate shape on performance and emissions of a diesel engine fuelled by diesel and biodiesel B20. Appl. Sci. 2022, 12, 1333. https://doi.org/10.3390/app12031333.
- Nishimura, T.; Satoh, K.; Takahashi, S.; Yokota, K. Effects of Fuel Injection Rate on Combustion and Emission in a DI Diesel Engine; SAE Technical Paper 981929; SAE International: Warrendale, PA, USA, 1998. https://doi.org/10.4271/981929.
- Suh, H.K.; Lee, C.S. Experimental and analytical study on the spray characteristics of dimethyl ether (DME) and diesel fuels within a common-rail injection system in a diesel engine. Fuel 2008, 87, 925–932. https://doi.org/10.1016/j.fuel.2007.05.051.
- Kim, M.Y.; Yoon, S.H.; Ryu, B.W.; Lee, C.S. Combustion and emission characteristics of DME as an alternative fuel for compression ignition engines with a high pressure injection system. Fuel 2008, 87, 2779–2786. https://doi.org/10.1016/j.fuel.2008.01.032.
- Cong, B.; LeBlanc, S.; Yu, X.; Zheng, M. Study of Dimethyl Ether Fuel Spray Characteristics and Injection Profile; SAE Technical Paper 2024-01-2702; SAE International: Warrendale, PA, USA, 2024. https://doi.org/10.4271/2024-01-2702.
- Bosch, W. The Fuel Rate Indicator: A New Measuring Instrument for Display of the Characteristics of Individual Injection; SAE Technical Paper 660749; SAE International: Warrendale, PA, USA, 1966. https://doi.org/10.4271/660749.
- Ferrari, A.; Zhang, T. Benchmark between Bosch and Zeuch method–based flowmeters for the measurement of the fuel injection rate. Int. J. Engine Res. 2021, 22, 316–327. https://doi.org/10.1177/1468087419827732.
- Aljohani, B.S.; Ben Houidi, M.; Du, J.; Dyuisenakhmetov, A.; Mohan, B.; AlRamadan, A.; Roberts, W.L. Characterization of the rate of injection of diesel solenoid injectors operated in the multiple injection strategy: A comparison of the spray momentum and Bosch tube methods. Front. Mech. Eng. 2022, 8, 889255. https://doi.org/10.3389/fmech.2022.889255.
- LeBlanc, S. Spray Characteristics of Dimethyl Ether in a Direct Injection Application. Master’s Thesis, University of Windsor, Windsor, ON, Canada, 2019.
- Benajes, J.; Pastor, J.V.; Payri, R.; Plazas, A.H. Analysis of the influence of diesel nozzle geometry in the injection rate characteristic. J. Fluids Eng. 2004, 126, 63–71. https://doi.org/10.1115/1.1637636.
- Dernotte, J.; Hespel, C.; Foucher, F.; Houillé, S; Mounaïm-Rousselle, C. Influence of physical fuel properties on the injection rate in a diesel injector. Fuel 2012, 96, 153–160. https://doi.org/10.1016/j.fuel.2011.11.073.